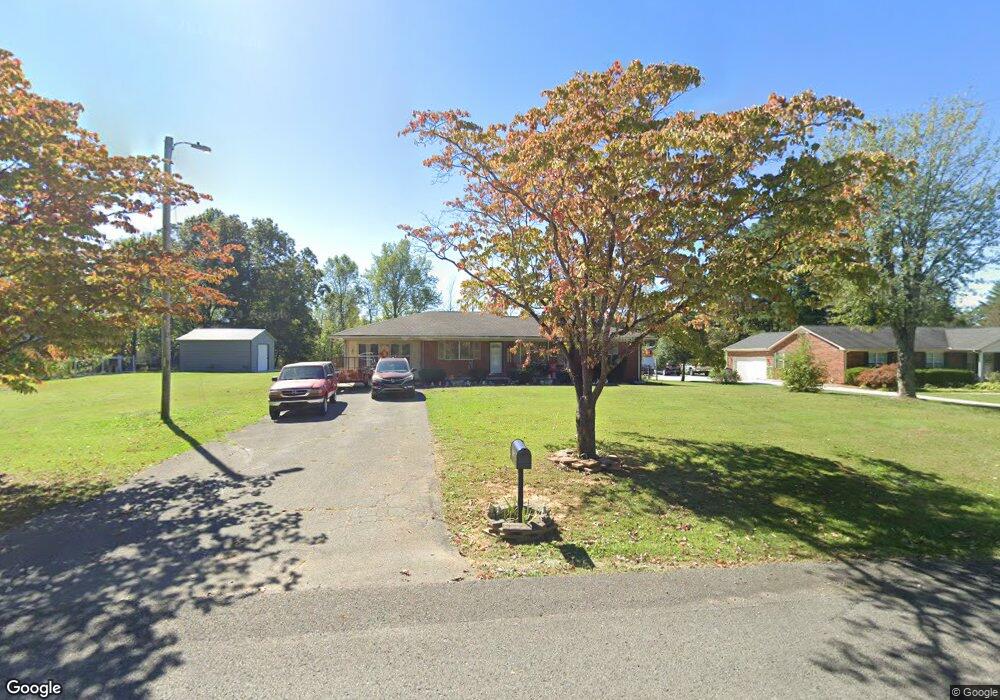
1869 R D Anderson Rd Cookeville, TN 38506
Estimated Value: $293,272 - $333,000
3
Beds
2
Baths
1,940
Sq Ft
$162/Sq Ft
Est. Value
About This Home
This home is located at 1869 R D Anderson Rd, Cookeville, TN 38506 and is currently estimated at $314,318, approximately $162 per square foot. 1869 R D Anderson Rd is a home located in Putnam County with nearby schools including Cookeville High School, Northeast Elementary School, and Algood Middle School.
Ownership History
Date
Name
Owned For
Owner Type
Purchase Details
Closed on
Jul 21, 2006
Sold by
Jackie Smith
Bought by
Victor Herrera and Victor Rhina
Current Estimated Value
Home Financials for this Owner
Home Financials are based on the most recent Mortgage that was taken out on this home.
Original Mortgage
$66,500
Outstanding Balance
$39,545
Interest Rate
6.68%
Estimated Equity
$274,773
Purchase Details
Closed on
Jul 19, 1999
Sold by
Puckett Jeffrey A
Bought by
Jackie Smith and Jackie Cindy
Home Financials for this Owner
Home Financials are based on the most recent Mortgage that was taken out on this home.
Original Mortgage
$82,900
Interest Rate
7.66%
Purchase Details
Closed on
Mar 21, 1996
Bought by
Puckett Jeffrey A
Purchase Details
Closed on
Aug 4, 1994
Bought by
Puckett Gene and Puckett Faye
Purchase Details
Closed on
Aug 28, 1990
Bought by
Williams Paula Luanne and Williams Lynn M Go
Purchase Details
Closed on
Aug 5, 1971
Bought by
Goolsby Goolsby W and Goolsby Lucille
Create a Home Valuation Report for This Property
The Home Valuation Report is an in-depth analysis detailing your home's value as well as a comparison with similar homes in the area
Home Values in the Area
Average Home Value in this Area
Purchase History
| Date | Buyer | Sale Price | Title Company |
|---|---|---|---|
| Victor Herrera | $132,250 | -- | |
| Jackie Smith | $89,900 | -- | |
| Puckett Jeffrey A | $53,000 | -- | |
| Puckett Gene | $80,000 | -- | |
| Williams Paula Luanne | -- | -- | |
| Goolsby Goolsby W | -- | -- |
Source: Public Records
Mortgage History
| Date | Status | Borrower | Loan Amount |
|---|---|---|---|
| Open | Goolsby Goolsby W | $66,500 | |
| Previous Owner | Goolsby Goolsby W | $82,900 |
Source: Public Records
Tax History Compared to Growth
Tax History
| Year | Tax Paid | Tax Assessment Tax Assessment Total Assessment is a certain percentage of the fair market value that is determined by local assessors to be the total taxable value of land and additions on the property. | Land | Improvement |
|---|---|---|---|---|
| 2024 | $1,109 | $41,700 | $4,800 | $36,900 |
| 2023 | $1,109 | $41,700 | $4,800 | $36,900 |
| 2022 | $1,031 | $41,700 | $4,800 | $36,900 |
| 2021 | $1,031 | $41,700 | $4,800 | $36,900 |
| 2020 | $808 | $41,700 | $4,800 | $36,900 |
| 2019 | $808 | $27,600 | $4,800 | $22,800 |
| 2018 | $672 | $24,600 | $4,800 | $19,800 |
| 2017 | $672 | $24,600 | $4,800 | $19,800 |
| 2016 | $672 | $24,600 | $4,800 | $19,800 |
| 2015 | $690 | $24,600 | $4,800 | $19,800 |
| 2014 | $697 | $24,848 | $0 | $0 |
Source: Public Records
Map
Nearby Homes
- 3124 Dogwood Ln
- 3354 Dogwood Ln
- 1522 Post Oak Rd
- 275 Quinland Lake Rd
- 2535 Middlebrook Rd
- 3073 Fisk Rd
- 340 2nd Ave N
- 3579 Hilham Rd
- 262 McCawley St
- 389 4th Ave N
- 2662 Bowser Rd
- 153 Mccauley St
- 2398 Nelson Way
- 2407 Couples Dr
- 2392 Nelson Way
- 727 Hutcheson Rd
- 2386 Nelson Way
- Violet Plan at The Reserve at the Country Club - The Reserve
- Ellery Plan at The Reserve at the Country Club - The Reserve
- 1869 Rd Anderson Rd
- 1855 Rd Anderson Rd
- 1907 Rd Anderson Rd
- 1847 Rd Anderson Rd
- Tract 3 R D Anderson Rd
- Tract 2 R D Anderson Rd
- Tract 1 R D Anderson Rd
- 150 AC R D Anderson Rd
- 1900 Rd Anderson Rd
- 1825 Rd Anderson Rd
- 1888 Quinland Lake Rd
- 1811 Rd Anderson Rd
- 1776 Quinland Lake Rd Unit A
- 1776 Quinland Lake Rd Unit B
- 1776 Quinland Lake Rd
- 1764 Quinland Lake Rd
- 1821 Quinland Lake Rd
- 1750 Quinland Lake Rd
- 1889 Quinland Lake Rd
- 1787 Quinland Lake Rd