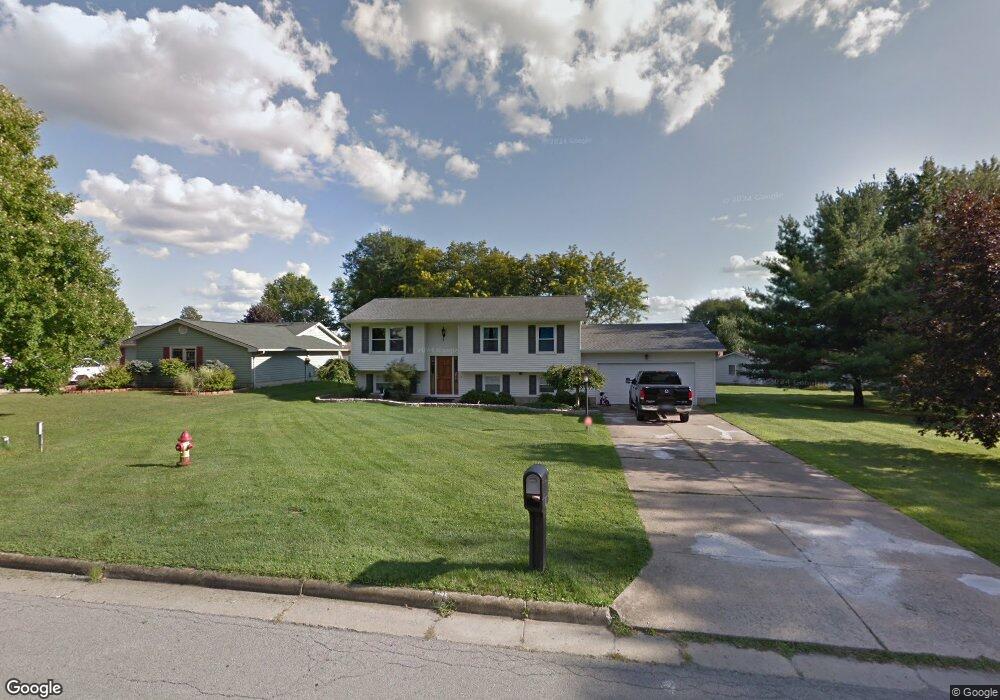
187 Carter Cir Youngstown, OH 44512
Estimated Value: $211,000 - $239,000
3
Beds
2
Baths
1,988
Sq Ft
$113/Sq Ft
Est. Value
About This Home
This home is located at 187 Carter Cir, Youngstown, OH 44512 and is currently estimated at $225,314, approximately $113 per square foot. 187 Carter Cir is a home located in Mahoning County with nearby schools including Stadium Drive Elementary School, Boardman Center Middle School, and Boardman High School.
Ownership History
Date
Name
Owned For
Owner Type
Purchase Details
Closed on
Mar 25, 2024
Sold by
Le Thinh C
Bought by
Le-Hoang Living Trust and Le
Current Estimated Value
Purchase Details
Closed on
May 22, 2008
Sold by
Hoang Thinh V
Bought by
Le Thinh C
Home Financials for this Owner
Home Financials are based on the most recent Mortgage that was taken out on this home.
Original Mortgage
$80,000
Interest Rate
5.58%
Mortgage Type
New Conventional
Purchase Details
Closed on
May 16, 2001
Sold by
Schmidt John L
Bought by
Hoang Thinh
Home Financials for this Owner
Home Financials are based on the most recent Mortgage that was taken out on this home.
Original Mortgage
$84,000
Interest Rate
6.57%
Purchase Details
Closed on
Aug 31, 1994
Bought by
Schmidt John L
Purchase Details
Closed on
Jun 29, 1992
Bought by
Caputo Mary Gail
Create a Home Valuation Report for This Property
The Home Valuation Report is an in-depth analysis detailing your home's value as well as a comparison with similar homes in the area
Home Values in the Area
Average Home Value in this Area
Purchase History
| Date | Buyer | Sale Price | Title Company |
|---|---|---|---|
| Le-Hoang Living Trust | -- | None Listed On Document | |
| Le Thinh C | $100,000 | Genuine Title Llc | |
| Hoang Thinh | $105,000 | -- | |
| Schmidt John L | $93,900 | -- | |
| Caputo Mary Gail | -- | -- |
Source: Public Records
Mortgage History
| Date | Status | Borrower | Loan Amount |
|---|---|---|---|
| Previous Owner | Le Thinh C | $80,000 | |
| Previous Owner | Hoang Thinh | $84,000 |
Source: Public Records
Tax History Compared to Growth
Tax History
| Year | Tax Paid | Tax Assessment Tax Assessment Total Assessment is a certain percentage of the fair market value that is determined by local assessors to be the total taxable value of land and additions on the property. | Land | Improvement |
|---|---|---|---|---|
| 2024 | $3,129 | $61,060 | $11,450 | $49,610 |
| 2023 | $3,088 | $61,060 | $11,450 | $49,610 |
| 2022 | $3,288 | $49,840 | $11,450 | $38,390 |
| 2021 | $3,290 | $49,840 | $11,450 | $38,390 |
| 2020 | $3,218 | $48,470 | $11,450 | $37,020 |
| 2019 | $2,904 | $38,460 | $9,080 | $29,380 |
| 2018 | $2,514 | $38,460 | $9,080 | $29,380 |
| 2017 | $2,335 | $38,460 | $9,080 | $29,380 |
| 2016 | $2,197 | $33,760 | $9,080 | $24,680 |
| 2015 | $2,154 | $33,760 | $9,080 | $24,680 |
| 2014 | $2,160 | $33,760 | $9,080 | $24,680 |
| 2013 | $2,133 | $33,760 | $9,080 | $24,680 |
Source: Public Records
Map
Nearby Homes
- 8502 Glenwood Ave
- 153 Creston Dr
- 74 Carter Cir
- 470 Garver Dr
- 9144 Sharrott Rd
- 0 W Western Reserve Rd Unit 5146459
- 9264 Sharrott Rd Unit 1004
- 9264 Sharrott Rd Unit 1001
- 9264 Sharrott Rd Unit 104
- 9264 Sharrott Rd Unit 1002
- Rosewood Plan at Courtyards at Stonegate
- 1555 W Western Reserve Rd
- 8218 Maramont Dr Unit B
- 123 Mayflower Dr
- Lot 43 Berklee Dr
- Lot 36 Berklee Dr
- Lot 44 Berklee Dr
- Lot 37 Berklee Dr
- 134 Mayflower Dr
- 150 Cedars Dr
- 8519 Glenwood Ave
- 8511 Glenwood Ave
- 8527 Glenwood Ave
- 179 Carter Cir
- 186 Carter Cir
- 8503 Glenwood Ave
- 190 Carter Cir
- 182 Carter Cir
- 182 Runnemede Dr
- 178 Runnemede Dr
- 194 Carter Cir
- 175 Carter Cir
- 178 Carter Cir
- 186 Runnemede Dr
- 176 Runnemede Dr
- 198 Carter Cir
- 174 Carter Cir
- 171 Carter Cir
- 172 Runnemede Dr
- 8526 Glenwood Ave