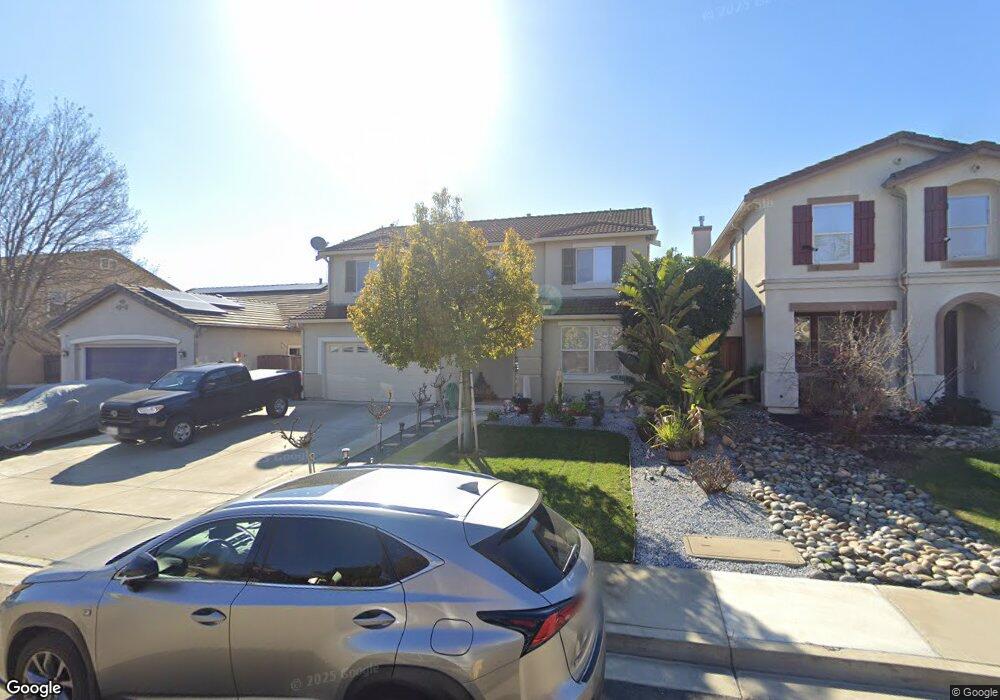
187 Douglas Rd Oakley, CA 94561
South Oakley NeighborhoodEstimated Value: $651,000 - $687,000
3
Beds
3
Baths
2,268
Sq Ft
$295/Sq Ft
Est. Value
About This Home
This home is located at 187 Douglas Rd, Oakley, CA 94561 and is currently estimated at $668,766, approximately $294 per square foot. 187 Douglas Rd is a home located in Contra Costa County with nearby schools including Gehringer Elementary School, Delta Vista Middle School, and Freedom High School.
Ownership History
Date
Name
Owned For
Owner Type
Purchase Details
Closed on
Nov 25, 2015
Sold by
Lopez Jose A and Lopez Rosa M
Bought by
Catiller Jerome and Catiller Catalina
Current Estimated Value
Home Financials for this Owner
Home Financials are based on the most recent Mortgage that was taken out on this home.
Original Mortgage
$408,576
Outstanding Balance
$318,028
Interest Rate
3.73%
Mortgage Type
VA
Estimated Equity
$350,738
Purchase Details
Closed on
Aug 5, 2005
Sold by
Lopez Jose A and Lopez Rosa M
Bought by
Lopez Jose A and Lopez Rosa M
Home Financials for this Owner
Home Financials are based on the most recent Mortgage that was taken out on this home.
Original Mortgage
$359,650
Interest Rate
5.48%
Mortgage Type
Stand Alone Refi Refinance Of Original Loan
Purchase Details
Closed on
May 28, 2002
Sold by
Kb Home South Bay Inc
Bought by
Lopez Jose A and Lopez Rosa A
Home Financials for this Owner
Home Financials are based on the most recent Mortgage that was taken out on this home.
Original Mortgage
$235,500
Interest Rate
6.17%
Mortgage Type
Purchase Money Mortgage
Create a Home Valuation Report for This Property
The Home Valuation Report is an in-depth analysis detailing your home's value as well as a comparison with similar homes in the area
Home Values in the Area
Average Home Value in this Area
Purchase History
| Date | Buyer | Sale Price | Title Company |
|---|---|---|---|
| Catiller Jerome | $399,000 | Chicago Title Company | |
| Lopez Jose A | -- | North American Title | |
| Lopez Jose A | $294,500 | First American Title |
Source: Public Records
Mortgage History
| Date | Status | Borrower | Loan Amount |
|---|---|---|---|
| Open | Catiller Jerome | $408,576 | |
| Previous Owner | Lopez Jose A | $359,650 | |
| Previous Owner | Lopez Jose A | $235,500 |
Source: Public Records
Tax History
| Year | Tax Paid | Tax Assessment Tax Assessment Total Assessment is a certain percentage of the fair market value that is determined by local assessors to be the total taxable value of land and additions on the property. | Land | Improvement |
|---|---|---|---|---|
| 2025 | $6,997 | $472,327 | $63,921 | $408,406 |
| 2024 | $6,780 | $463,067 | $62,668 | $400,399 |
| 2023 | $6,780 | $453,989 | $61,440 | $392,549 |
| 2022 | $6,696 | $445,088 | $60,236 | $384,852 |
| 2021 | $6,569 | $436,361 | $59,055 | $377,306 |
| 2019 | $6,266 | $423,420 | $57,304 | $366,116 |
| 2018 | $6,094 | $415,119 | $56,181 | $358,938 |
| 2017 | $6,025 | $406,980 | $55,080 | $351,900 |
| 2016 | $5,709 | $399,000 | $54,000 | $345,000 |
| 2015 | $5,223 | $354,648 | $108,452 | $246,196 |
| 2014 | $4,890 | $324,000 | $99,080 | $224,920 |
Source: Public Records
Map
Nearby Homes
- 34 Fuller Ct
- 190 Raye Ave
- 433 Ramos Ranch Rd
- 29 Diane Ct
- 13 Kearsti Ct
- 410 Malicoat Ave
- 75 E Bolton Rd Unit 29
- 241 Yellow Rose Cir
- 1226 Sierra Trail Rd
- 629 Pipa Ln
- 25 Solitude Ct
- 234 Oak View Ln
- 81 Yula Way
- 109 Muir Ct
- 3879 Harvest Cir
- 471 Delta Rd
- 2099 Meadowlark Ln
- 1327 Tuolumne Way
- 104 Kings Canyon Way
- 322 Barn Dance Way
Your Personal Tour Guide
Ask me questions while you tour the home.