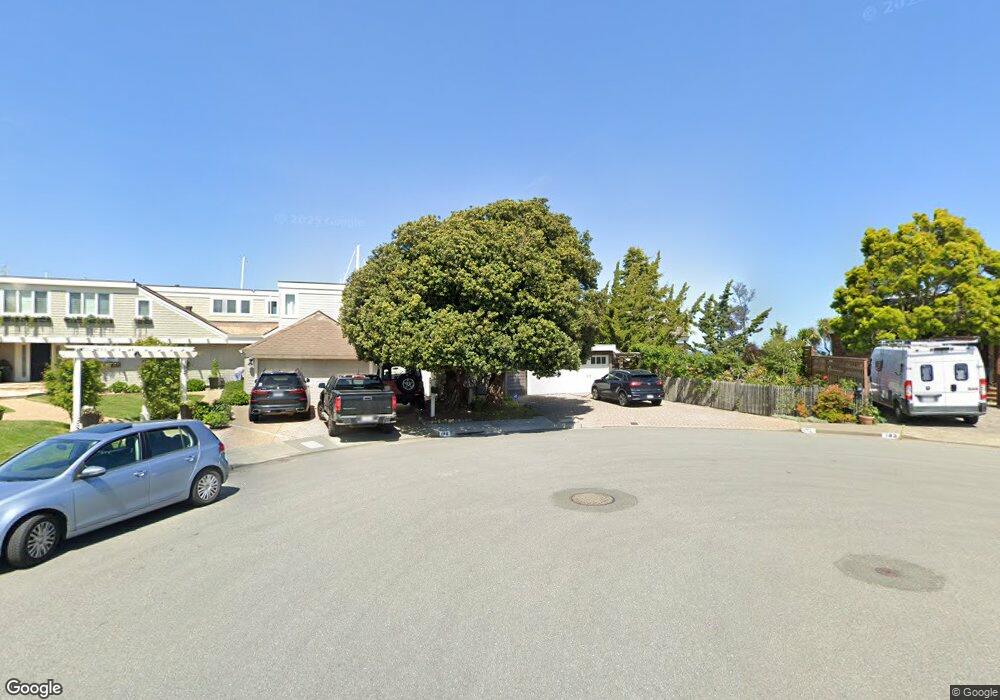
187 Saint Thomas Way Belvedere Tiburon, CA 94920
Estimated Value: $2,901,151 - $3,747,000
4
Beds
2
Baths
2,400
Sq Ft
$1,343/Sq Ft
Est. Value
About This Home
This home is located at 187 Saint Thomas Way, Belvedere Tiburon, CA 94920 and is currently estimated at $3,223,538, approximately $1,343 per square foot. 187 Saint Thomas Way is a home located in Marin County with nearby schools including Bel Aire Elementary School, Reed Elementary School, and Del Mar Middle School.
Ownership History
Date
Name
Owned For
Owner Type
Purchase Details
Closed on
Mar 6, 2020
Sold by
Belloy Marisa Barbour De
Bought by
Lienard Alexis De Belloy De Saint and Belloy Marisa Barbour
Current Estimated Value
Purchase Details
Closed on
Jul 22, 2013
Sold by
Lane Peter J and Lane Kristen M
Bought by
Debelloy Marisa Barbour
Purchase Details
Closed on
Jun 7, 2004
Sold by
Saltzman Marietta G
Bought by
Lane Peter J and Lane Kristen M
Home Financials for this Owner
Home Financials are based on the most recent Mortgage that was taken out on this home.
Original Mortgage
$1,000,000
Interest Rate
5.25%
Mortgage Type
Purchase Money Mortgage
Purchase Details
Closed on
Dec 20, 1993
Sold by
Saltzman Barry K and Saltzman Marietta G
Bought by
Saltzman Barry K and Saltzman Marietta G
Create a Home Valuation Report for This Property
The Home Valuation Report is an in-depth analysis detailing your home's value as well as a comparison with similar homes in the area
Home Values in the Area
Average Home Value in this Area
Purchase History
| Date | Buyer | Sale Price | Title Company |
|---|---|---|---|
| Lienard Alexis De Belloy De Saint | -- | None Available | |
| Debelloy Marisa Barbour | $2,150,000 | First American Title Company | |
| Lane Peter J | $2,100,000 | -- | |
| Saltzman Barry K | -- | -- |
Source: Public Records
Mortgage History
| Date | Status | Borrower | Loan Amount |
|---|---|---|---|
| Previous Owner | Lane Peter J | $1,000,000 | |
| Closed | Lane Peter J | $680,000 |
Source: Public Records
Tax History Compared to Growth
Tax History
| Year | Tax Paid | Tax Assessment Tax Assessment Total Assessment is a certain percentage of the fair market value that is determined by local assessors to be the total taxable value of land and additions on the property. | Land | Improvement |
|---|---|---|---|---|
| 2025 | $31,841 | $2,630,588 | $1,593,553 | $1,037,035 |
| 2024 | $31,841 | $2,579,019 | $1,562,314 | $1,016,705 |
| 2023 | $31,112 | $2,528,460 | $1,531,686 | $996,774 |
| 2022 | $30,694 | $2,478,887 | $1,501,656 | $977,231 |
| 2021 | $30,135 | $2,430,302 | $1,472,224 | $958,078 |
| 2020 | $29,837 | $2,405,387 | $1,457,131 | $948,256 |
| 2019 | $29,300 | $2,358,239 | $1,428,570 | $929,669 |
| 2018 | $28,709 | $2,312,014 | $1,400,568 | $911,446 |
| 2017 | $28,256 | $2,266,691 | $1,373,112 | $893,579 |
| 2016 | $26,833 | $2,222,247 | $1,346,189 | $876,058 |
| 2015 | $26,907 | $2,188,877 | $1,325,974 | $862,903 |
| 2014 | $26,065 | $2,146,000 | $1,300,000 | $846,000 |
Source: Public Records
Map
Nearby Homes
- 9 Saint Lucia Place
- 220 Jamaica St
- 0 Trinidad Dr
- 4664 Paradise Dr
- 139 Trinidad Dr
- 86 Saint Thomas Way
- 79 Saint Thomas Way
- 4980 Paradise Dr
- 4095 Paradise Dr
- 22 Venus Ct
- 3800 Paradise Dr
- 2800 Paradise Dr
- 3 Trestle Glen Cir
- 25 Mark Terrace
- 16 Tradewind Passage
- 40 Norman Way
- 472 Irving Ct
- 137 Granada Dr
- 10 East Terrace
- 139 Gilmartin Dr
- 183 Saint Thomas Way
- 186 Saint Thomas Way
- 182 Saint Thomas Way
- 179 Saint Thomas Way
- 179 Saint Thomas Way
- 178 Saint Thomas Way
- 175 Saint Thomas Way
- 174 Saint Thomas Way
- 171 Saint Thomas Way
- 16 Saint Lucia Place
- 170 Saint Thomas Way
- 18 Saint Lucia Place
- 12 Saint Lucia Place
- 167 Saint Thomas Way
- 166 Saint Thomas Way
- 10 Saint Lucia Place
- 19 Saint Lucia Place
- 162 Saint Thomas Way
- 163 Saint Thomas Way
- 8 Saint Lucia Place