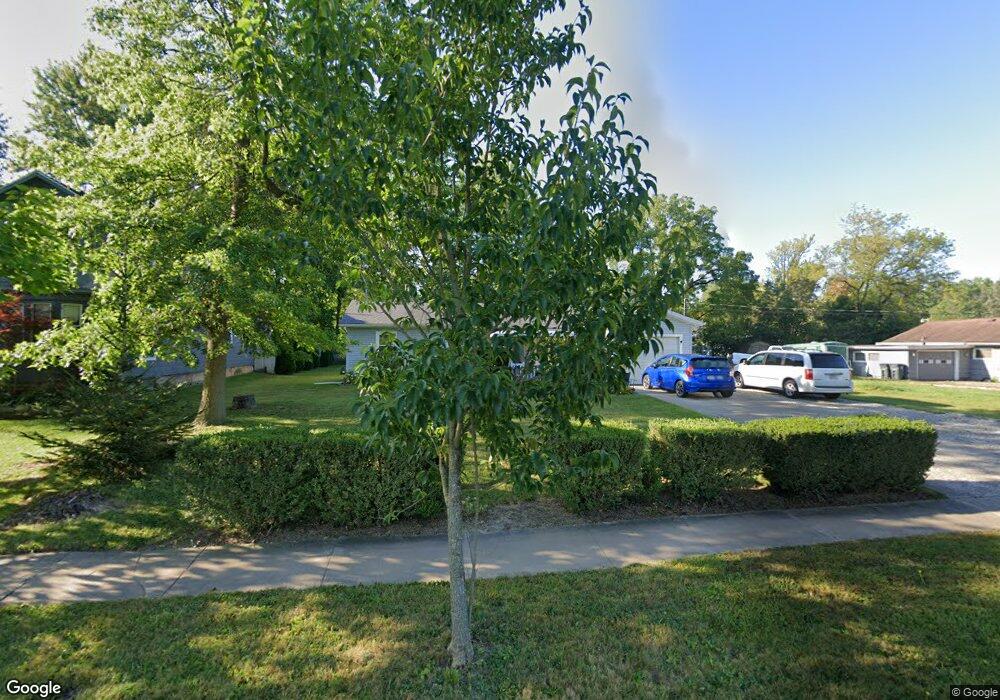
187 Sumner St Oberlin, OH 44074
Estimated Value: $150,000 - $182,940
3
Beds
2
Baths
1,308
Sq Ft
$127/Sq Ft
Est. Value
About This Home
This home is located at 187 Sumner St, Oberlin, OH 44074 and is currently estimated at $166,485, approximately $127 per square foot. 187 Sumner St is a home located in Lorain County with nearby schools including Oberlin Elementary School, Prospect Elementary School, and Langston Middle School.
Ownership History
Date
Name
Owned For
Owner Type
Purchase Details
Closed on
Jun 25, 2003
Sold by
Bank Of New York
Bought by
Sheetz James A
Current Estimated Value
Home Financials for this Owner
Home Financials are based on the most recent Mortgage that was taken out on this home.
Original Mortgage
$51,000
Outstanding Balance
$19,850
Interest Rate
4.25%
Mortgage Type
Purchase Money Mortgage
Estimated Equity
$146,635
Purchase Details
Closed on
Dec 16, 2002
Sold by
Mason Lester and Mason Rose Marie
Bought by
Bank Of New York
Purchase Details
Closed on
Feb 24, 1999
Sold by
Lofties Leslene D
Bought by
Mason Lester
Purchase Details
Closed on
Nov 24, 1998
Sold by
Lester Mason
Bought by
Mason Lester and Walker Rose Marie
Home Financials for this Owner
Home Financials are based on the most recent Mortgage that was taken out on this home.
Original Mortgage
$42,100
Interest Rate
12.75%
Create a Home Valuation Report for This Property
The Home Valuation Report is an in-depth analysis detailing your home's value as well as a comparison with similar homes in the area
Home Values in the Area
Average Home Value in this Area
Purchase History
| Date | Buyer | Sale Price | Title Company |
|---|---|---|---|
| Sheetz James A | $51,000 | Midland Title Security Inc | |
| Bank Of New York | $46,000 | -- | |
| Mason Lester | -- | -- | |
| Mason Lester | $30,000 | -- |
Source: Public Records
Mortgage History
| Date | Status | Borrower | Loan Amount |
|---|---|---|---|
| Open | Sheetz James A | $51,000 | |
| Previous Owner | Mason Lester | $42,100 |
Source: Public Records
Tax History Compared to Growth
Tax History
| Year | Tax Paid | Tax Assessment Tax Assessment Total Assessment is a certain percentage of the fair market value that is determined by local assessors to be the total taxable value of land and additions on the property. | Land | Improvement |
|---|---|---|---|---|
| 2024 | $2,389 | $47,838 | $8,614 | $39,225 |
| 2023 | $1,586 | $28,084 | $4,778 | $23,307 |
| 2022 | $1,544 | $28,084 | $4,778 | $23,307 |
| 2021 | $1,539 | $28,084 | $4,778 | $23,307 |
| 2020 | $1,432 | $24,620 | $4,190 | $20,430 |
| 2019 | $1,408 | $24,620 | $4,190 | $20,430 |
| 2018 | $1,449 | $24,620 | $4,190 | $20,430 |
| 2017 | $1,480 | $26,970 | $3,980 | $22,990 |
| 2016 | $1,494 | $26,970 | $3,980 | $22,990 |
| 2015 | $1,496 | $26,970 | $3,980 | $22,990 |
| 2014 | $1,465 | $25,750 | $3,760 | $21,990 |
| 2013 | $1,440 | $25,750 | $3,760 | $21,990 |
Source: Public Records
Map
Nearby Homes
- 62 Locust St
- 359 S Pleasant St
- 182 E Hamilton St
- 83 S Pleasant St
- 63 Spring St
- 360 S Main St
- 110 Shipherd Cir
- 95 Shipherd Cir
- 44 W Vine St
- 81 S Professor St
- 147 Morgan St
- 149 Morgan St
- 111 N Pleasant St
- 263 W Lincoln St
- 257 Morgan St
- 235 Elm St
- 396 Reserve Ave
- 232 Elm St
- 246 W Hamilton St
- 216 N Main St