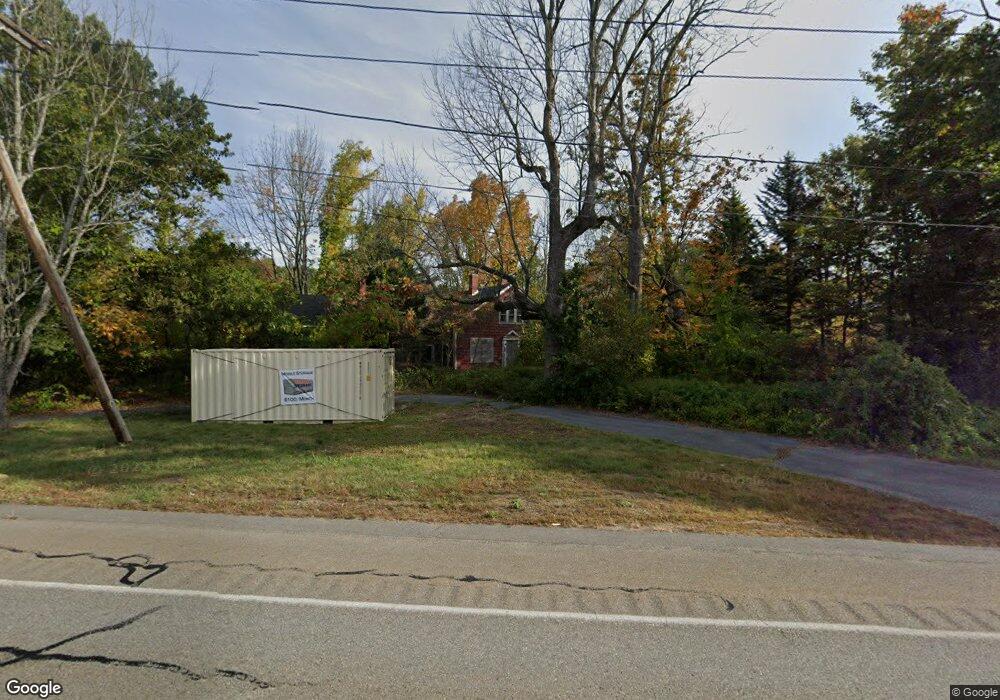
187 W Main St Westminster, MA 01473
Estimated Value: $385,000 - $717,000
2
Beds
1
Bath
960
Sq Ft
$630/Sq Ft
Est. Value
About This Home
This home is located at 187 W Main St, Westminster, MA 01473 and is currently estimated at $604,329, approximately $629 per square foot. 187 W Main St is a home located in Worcester County with nearby schools including Oakmont Regional High School, Holy Family Academy, and Wachusett Hills Christian School.
Ownership History
Date
Name
Owned For
Owner Type
Purchase Details
Closed on
Jan 16, 2024
Sold by
Koski Joyce A Est and Maragioglio
Bought by
Snow Hill Development Llc
Current Estimated Value
Home Financials for this Owner
Home Financials are based on the most recent Mortgage that was taken out on this home.
Original Mortgage
$300,000
Outstanding Balance
$294,829
Interest Rate
7.03%
Mortgage Type
Purchase Money Mortgage
Estimated Equity
$309,500
Purchase Details
Closed on
Aug 12, 1980
Bought by
Koski Eva C and Koski Joyce A
Create a Home Valuation Report for This Property
The Home Valuation Report is an in-depth analysis detailing your home's value as well as a comparison with similar homes in the area
Home Values in the Area
Average Home Value in this Area
Purchase History
| Date | Buyer | Sale Price | Title Company |
|---|---|---|---|
| Snow Hill Development Llc | $600,000 | None Available | |
| Koski Eva C | -- | -- |
Source: Public Records
Mortgage History
| Date | Status | Borrower | Loan Amount |
|---|---|---|---|
| Open | Snow Hill Development Llc | $300,000 |
Source: Public Records
Tax History Compared to Growth
Tax History
| Year | Tax Paid | Tax Assessment Tax Assessment Total Assessment is a certain percentage of the fair market value that is determined by local assessors to be the total taxable value of land and additions on the property. | Land | Improvement |
|---|---|---|---|---|
| 2025 | $3,004 | $244,200 | $169,000 | $75,200 |
| 2024 | $2,735 | $223,100 | $169,000 | $54,100 |
| 2023 | $2,756 | $211,000 | $157,900 | $53,100 |
| 2022 | $2,838 | $179,600 | $142,300 | $37,300 |
| 2021 | $2,685 | $160,200 | $124,500 | $35,700 |
| 2020 | $2,806 | $159,900 | $124,200 | $35,700 |
| 2019 | $2,677 | $146,700 | $111,000 | $35,700 |
| 2018 | $2,666 | $143,700 | $114,600 | $29,100 |
| 2017 | $2,472 | $135,900 | $107,500 | $28,400 |
| 2016 | $2,342 | $124,700 | $97,200 | $27,500 |
| 2015 | $2,363 | $124,700 | $97,200 | $27,500 |
| 2014 | $2,367 | $124,700 | $97,200 | $27,500 |
Source: Public Records
Map
Nearby Homes