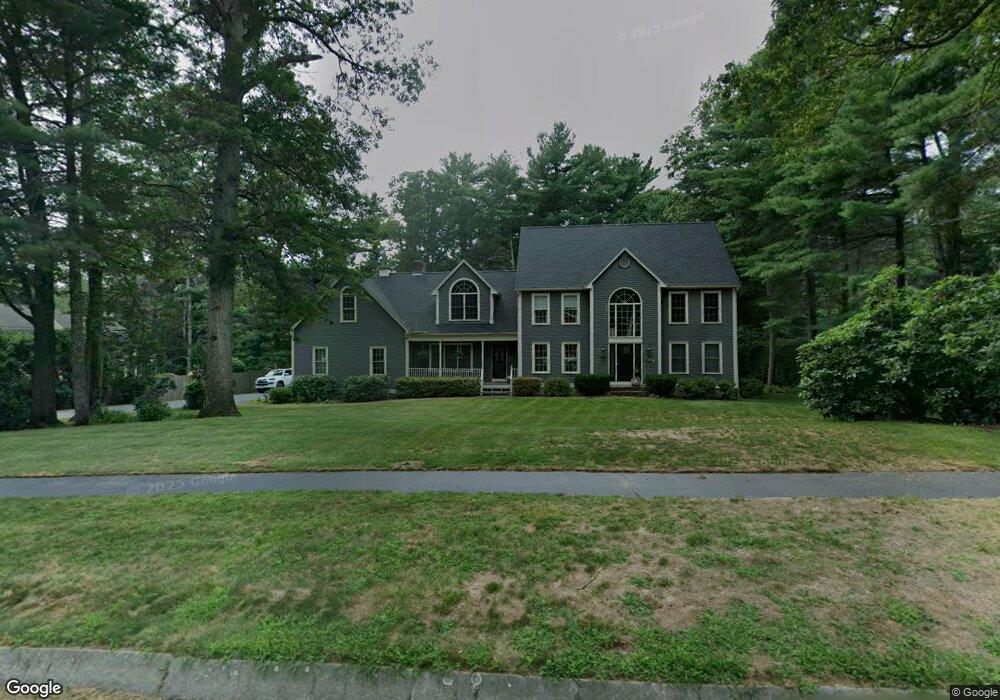
187 York Rd Mansfield, MA 02048
Estimated Value: $1,074,876 - $1,175,000
4
Beds
3
Baths
3,482
Sq Ft
$320/Sq Ft
Est. Value
About This Home
This home is located at 187 York Rd, Mansfield, MA 02048 and is currently estimated at $1,115,292, approximately $320 per square foot. 187 York Rd is a home located in Bristol County with nearby schools including Everett W. Robinson Elementary School, Jordan/Jackson Elementary School, and Harold L. Qualters Middle School.
Ownership History
Date
Name
Owned For
Owner Type
Purchase Details
Closed on
Dec 2, 1992
Sold by
Brookdale Corp
Bought by
Hoy Paul A and Hoy Kimberly E
Current Estimated Value
Home Financials for this Owner
Home Financials are based on the most recent Mortgage that was taken out on this home.
Original Mortgage
$266,400
Interest Rate
8.22%
Mortgage Type
Purchase Money Mortgage
Create a Home Valuation Report for This Property
The Home Valuation Report is an in-depth analysis detailing your home's value as well as a comparison with similar homes in the area
Home Values in the Area
Average Home Value in this Area
Purchase History
| Date | Buyer | Sale Price | Title Company |
|---|---|---|---|
| Hoy Paul A | $333,000 | -- |
Source: Public Records
Mortgage History
| Date | Status | Borrower | Loan Amount |
|---|---|---|---|
| Open | Hoy Paul A | $160,000 | |
| Closed | Hoy Paul A | $260,000 | |
| Closed | Hoy Paul A | $266,400 | |
| Closed | Hoy Paul A | $266,400 |
Source: Public Records
Tax History Compared to Growth
Tax History
| Year | Tax Paid | Tax Assessment Tax Assessment Total Assessment is a certain percentage of the fair market value that is determined by local assessors to be the total taxable value of land and additions on the property. | Land | Improvement |
|---|---|---|---|---|
| 2025 | $12,789 | $971,100 | $302,600 | $668,500 |
| 2024 | $11,844 | $877,300 | $266,300 | $611,000 |
| 2023 | $11,262 | $799,300 | $266,300 | $533,000 |
| 2022 | $10,739 | $707,900 | $246,500 | $461,400 |
| 2021 | $11,030 | $718,100 | $224,200 | $493,900 |
| 2020 | $10,827 | $704,900 | $224,200 | $480,700 |
| 2019 | $10,541 | $692,600 | $202,200 | $490,400 |
| 2018 | $10,502 | $674,500 | $192,900 | $481,600 |
| 2017 | $9,847 | $655,600 | $187,400 | $468,200 |
| 2016 | $9,523 | $618,000 | $185,300 | $432,700 |
| 2015 | $9,233 | $595,700 | $185,300 | $410,400 |
Source: Public Records
Map
Nearby Homes
- 1730 West St
- 56 Jacob Dr
- 47 Old Farm Rd
- 17 Peters Way
- 14 Claire Ave
- 122 Mary Ann Way
- 1125 School St
- 36 Cranberry Rd
- 11 Landry Ave
- 10 Sleepy Hollow Cir
- 116 George St
- 16 Raymond Hall Dr
- 176 Elm St
- 33 Treasure Island Rd
- 24 Red Coat Ln
- 6 Colts Way
- 115 Westfield Dr
- 16 Treasure Island Rd
- 451R Gilbert St
- 2 Oak St Unit 2B