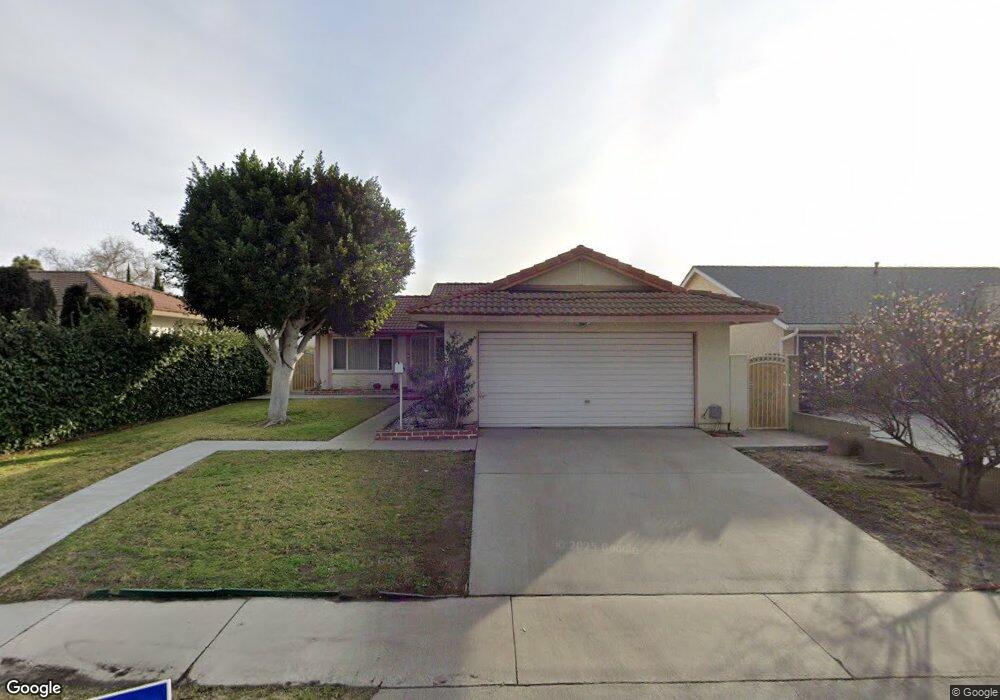
18702 Bloomfield Ave Cerritos, CA 90703
Estimated Value: $978,371 - $1,136,000
3
Beds
2
Baths
1,429
Sq Ft
$741/Sq Ft
Est. Value
About This Home
This home is located at 18702 Bloomfield Ave, Cerritos, CA 90703 and is currently estimated at $1,058,843, approximately $740 per square foot. 18702 Bloomfield Ave is a home located in Los Angeles County with nearby schools including Frank C. Leal Elementary School, Tetzlaff (Martin B.) Middle School, and Cerritos High School.
Ownership History
Date
Name
Owned For
Owner Type
Purchase Details
Closed on
Mar 29, 2010
Sold by
Chang Che C
Bought by
Chang Chi Ho
Current Estimated Value
Purchase Details
Closed on
Dec 12, 2009
Sold by
Chang Che C
Bought by
Chang Chi Ho
Purchase Details
Closed on
Nov 28, 2008
Sold by
Chang Paichuan
Bought by
Chang Paichuan and Chang Yu Y
Purchase Details
Closed on
Oct 12, 2008
Sold by
Chang Chi Ho
Bought by
Chang Che Chiang
Purchase Details
Closed on
Jun 15, 2008
Sold by
Chang Chi Ho
Bought by
Chang Che Chiang
Purchase Details
Closed on
Jun 7, 1999
Sold by
Mata Walner R
Bought by
Chang Chi Ho and Chang Shu Chen
Home Financials for this Owner
Home Financials are based on the most recent Mortgage that was taken out on this home.
Original Mortgage
$125,000
Interest Rate
7.12%
Create a Home Valuation Report for This Property
The Home Valuation Report is an in-depth analysis detailing your home's value as well as a comparison with similar homes in the area
Home Values in the Area
Average Home Value in this Area
Purchase History
| Date | Buyer | Sale Price | Title Company |
|---|---|---|---|
| Chang Chi Ho | -- | None Available | |
| Chang Chi Ho | -- | None Available | |
| Chang Paichuan | -- | None Available | |
| Chang Che Chiang | -- | None Available | |
| Chang Che Chiang | -- | None Available | |
| Chang Chi Ho | $245,000 | Fidelity Title |
Source: Public Records
Mortgage History
| Date | Status | Borrower | Loan Amount |
|---|---|---|---|
| Previous Owner | Chang Chi Ho | $125,000 |
Source: Public Records
Tax History
| Year | Tax Paid | Tax Assessment Tax Assessment Total Assessment is a certain percentage of the fair market value that is determined by local assessors to be the total taxable value of land and additions on the property. | Land | Improvement |
|---|---|---|---|---|
| 2025 | $4,703 | $376,535 | $231,612 | $144,923 |
| 2024 | $4,703 | $369,153 | $227,071 | $142,082 |
| 2023 | $4,554 | $361,916 | $222,619 | $139,297 |
| 2022 | $4,484 | $354,820 | $218,254 | $136,566 |
| 2021 | $4,379 | $347,864 | $213,975 | $133,889 |
| 2019 | $4,279 | $337,548 | $207,629 | $129,919 |
| 2018 | $3,947 | $330,930 | $203,558 | $127,372 |
| 2016 | $3,786 | $318,081 | $195,654 | $122,427 |
| 2015 | $3,738 | $313,305 | $192,716 | $120,589 |
| 2014 | $3,669 | $307,168 | $188,941 | $118,227 |
Source: Public Records
Map
Nearby Homes
- 18704 Stefani Ave
- 12361 Caravel Place
- 18622 Kamstra Ave
- 12342 Edgefield St
- 19335 Derbyshire Ln
- 12711 Castleford Ln
- 12233 Academy Way
- 12525 Semora St
- 12133 Candor Dr
- 13026 San Salvador Place
- 12143 Phoenix Dr
- 17602 Cortner Ave
- 12524 Bryce Cir
- 19922 Rainbow Way
- 13010 Artesia Blvd
- 11975 Gonsalves St
- 18727 Holmes Ave
- 12036 Wendy St
- 13202 Carolyn St
- 16918 Chaparral Ave Unit 27
- 18708 Bloomfield Ave
- 18630 Bloomfield Ave
- 18713 Bechard Place
- 18707 Bechard Place
- 18714 Bloomfield Ave
- 18717 Bechard Place
- 18705 Bechard Place
- 18718 Bloomfield Ave
- 18723 Bechard Place
- 18701 Bechard Place
- 18724 Bloomfield Ave
- 18729 Bechard Place
- 18616 Bloomfield Ave
- 18712 Bechard Place
- 18706 Bechard Place
- 18716 Bechard Place
- 18702 Bechard Place
- 18702 Danielle Ave
- 18728 Bloomfield Ave
- 18735 Bechard Place
Your Personal Tour Guide
Ask me questions while you tour the home.