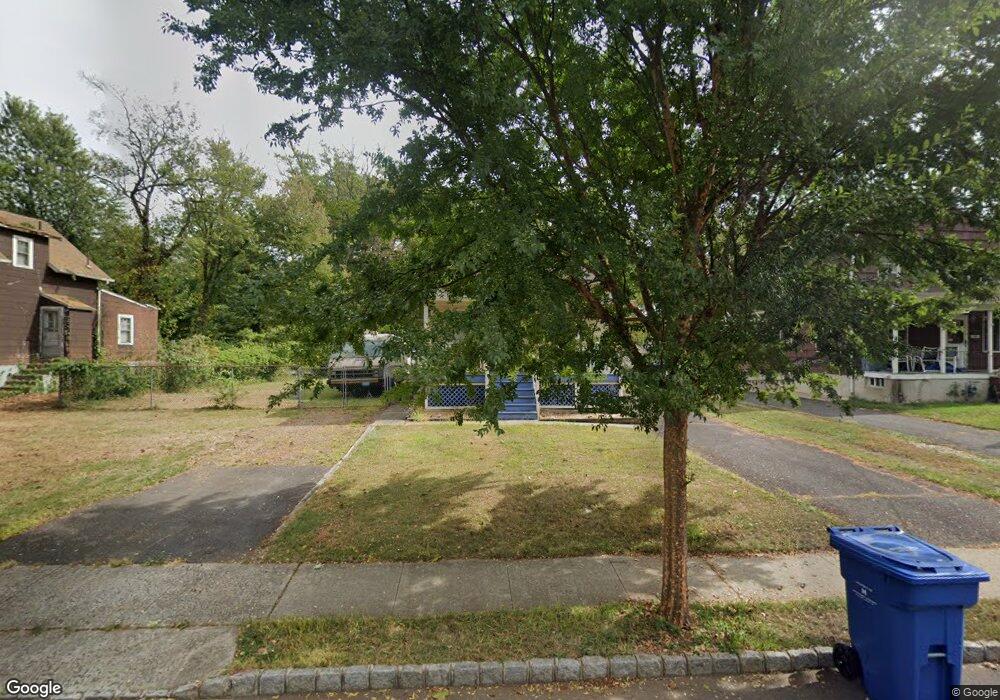
1871 W 5th St Piscataway, NJ 08854
Estimated Value: $397,000 - $503,000
--
Bed
--
Bath
1,165
Sq Ft
$376/Sq Ft
Est. Value
About This Home
This home is located at 1871 W 5th St, Piscataway, NJ 08854 and is currently estimated at $438,289, approximately $376 per square foot. 1871 W 5th St is a home located in Middlesex County with nearby schools including Arbor Intermediate School, Dwight D. Eisenhower School, and Quibbletown Middle School.
Ownership History
Date
Name
Owned For
Owner Type
Purchase Details
Closed on
Nov 6, 2015
Sold by
Case Brian S and Case Kristy M
Bought by
Case Brian S
Current Estimated Value
Home Financials for this Owner
Home Financials are based on the most recent Mortgage that was taken out on this home.
Original Mortgage
$157,390
Outstanding Balance
$123,963
Interest Rate
3.83%
Mortgage Type
New Conventional
Estimated Equity
$314,326
Purchase Details
Closed on
Apr 23, 2004
Purchase Details
Closed on
Jun 6, 1997
Sold by
Buchanan James
Bought by
Case Shirley and Case Brian
Home Financials for this Owner
Home Financials are based on the most recent Mortgage that was taken out on this home.
Original Mortgage
$95,000
Interest Rate
7.81%
Mortgage Type
FHA
Create a Home Valuation Report for This Property
The Home Valuation Report is an in-depth analysis detailing your home's value as well as a comparison with similar homes in the area
Home Values in the Area
Average Home Value in this Area
Purchase History
| Date | Buyer | Sale Price | Title Company |
|---|---|---|---|
| Case Brian S | -- | Title Source Inc | |
| -- | -- | -- | |
| Case Shirley | $99,000 | -- |
Source: Public Records
Mortgage History
| Date | Status | Borrower | Loan Amount |
|---|---|---|---|
| Open | Case Brian S | $157,390 | |
| Previous Owner | Case Shirley | $95,000 |
Source: Public Records
Tax History Compared to Growth
Tax History
| Year | Tax Paid | Tax Assessment Tax Assessment Total Assessment is a certain percentage of the fair market value that is determined by local assessors to be the total taxable value of land and additions on the property. | Land | Improvement |
|---|---|---|---|---|
| 2025 | $5,205 | $350,700 | $256,600 | $94,100 |
| 2024 | $5,434 | $266,500 | $165,600 | $100,900 |
| 2023 | $5,434 | $260,000 | $165,600 | $94,400 |
| 2022 | $5,664 | $251,600 | $165,600 | $86,000 |
| 2021 | $5,345 | $242,500 | $165,600 | $76,900 |
| 2020 | $5,478 | $234,500 | $135,600 | $98,900 |
| 2019 | $5,576 | $234,500 | $135,600 | $98,900 |
| 2018 | $5,434 | $228,700 | $135,600 | $93,100 |
| 2017 | $5,500 | $200,000 | $115,600 | $84,400 |
| 2016 | $5,394 | $200,000 | $115,600 | $84,400 |
| 2015 | $5,320 | $200,000 | $115,600 | $84,400 |
| 2014 | $5,200 | $200,000 | $115,600 | $84,400 |
Source: Public Records
Map
Nearby Homes
- 1866 W 7th St
- 203 Walnut St
- 118 Jadach Dr
- 233 Maple Ave
- 323 Oak Pkwy
- 1825 Brunella Ave
- 261 New Market Rd
- 220 S Washington Ave
- 417 Valmere Ave
- 203 S Washington Ave
- 1433 Dogwood Dr
- 1718 W 4th St
- 1724 Quincy St
- 325 Orange St
- 1515 Dogwood Dr
- 250 Whittier Ave
- 423 New Market Rd
- 456 Valmere Ave
- 511 Grove St