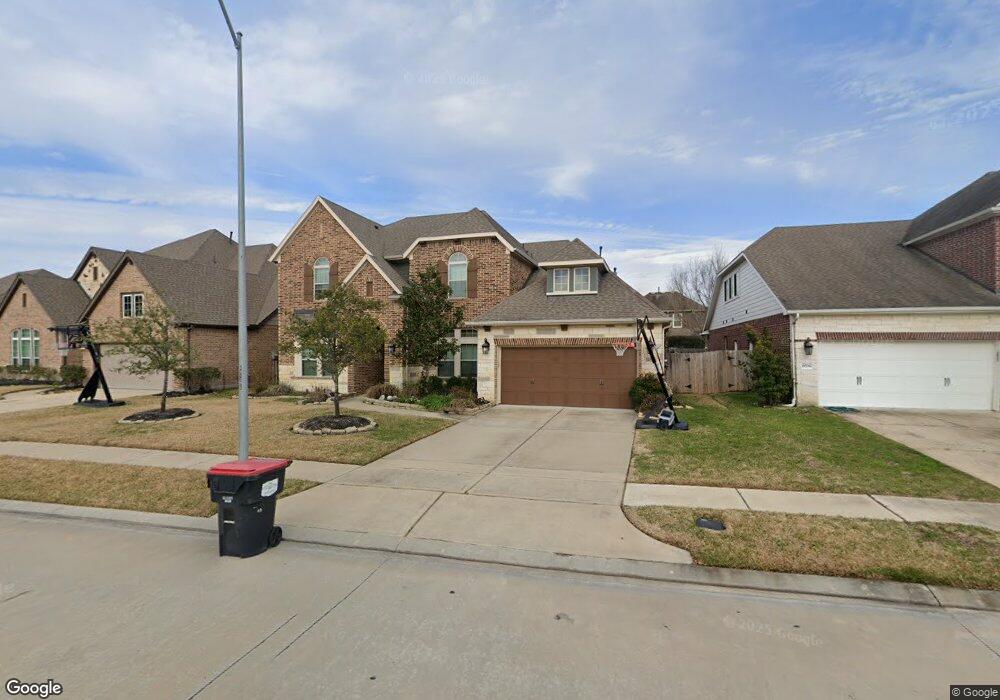
18710 Tamer View Tomball, TX 77377
Northpointe NeighborhoodEstimated Value: $573,657 - $593,000
4
Beds
5
Baths
3,466
Sq Ft
$168/Sq Ft
Est. Value
About This Home
This home is located at 18710 Tamer View, Tomball, TX 77377 and is currently estimated at $583,414, approximately $168 per square foot. 18710 Tamer View is a home located in Harris County with nearby schools including Canyon Pointe Elementary School, Oakcrest Intermediate School, and Tomball Memorial High School.
Ownership History
Date
Name
Owned For
Owner Type
Purchase Details
Closed on
Sep 26, 2024
Sold by
Birch Cory and Birch Catherine
Bought by
Denicola Nicholas and Benson Jaymi
Current Estimated Value
Home Financials for this Owner
Home Financials are based on the most recent Mortgage that was taken out on this home.
Original Mortgage
$555,750
Outstanding Balance
$550,061
Interest Rate
6.49%
Mortgage Type
New Conventional
Estimated Equity
$33,353
Purchase Details
Closed on
Oct 13, 2016
Sold by
Wwekley Homes Llc
Bought by
Birch Cory and Birch Catherine
Home Financials for this Owner
Home Financials are based on the most recent Mortgage that was taken out on this home.
Original Mortgage
$360,974
Interest Rate
3.46%
Mortgage Type
New Conventional
Purchase Details
Closed on
Jan 28, 2016
Sold by
Blue Ridge Partners Ltd
Bought by
Weekley Homes Llc
Create a Home Valuation Report for This Property
The Home Valuation Report is an in-depth analysis detailing your home's value as well as a comparison with similar homes in the area
Home Values in the Area
Average Home Value in this Area
Purchase History
| Date | Buyer | Sale Price | Title Company |
|---|---|---|---|
| Denicola Nicholas | -- | Stewart Title | |
| Birch Cory | -- | Chicago Title | |
| Weekley Homes Llc | -- | None Available |
Source: Public Records
Mortgage History
| Date | Status | Borrower | Loan Amount |
|---|---|---|---|
| Open | Denicola Nicholas | $555,750 | |
| Previous Owner | Birch Cory | $360,974 |
Source: Public Records
Tax History Compared to Growth
Tax History
| Year | Tax Paid | Tax Assessment Tax Assessment Total Assessment is a certain percentage of the fair market value that is determined by local assessors to be the total taxable value of land and additions on the property. | Land | Improvement |
|---|---|---|---|---|
| 2025 | $12,456 | $568,558 | $89,328 | $479,230 |
| 2024 | $12,456 | $568,736 | $88,524 | $480,212 |
| 2023 | $12,456 | $568,736 | $88,524 | $480,212 |
| 2022 | $13,077 | $488,349 | $72,428 | $415,921 |
| 2021 | $10,878 | $388,991 | $61,162 | $327,829 |
| 2020 | $10,878 | $371,413 | $61,162 | $310,251 |
| 2019 | $11,714 | $388,703 | $61,162 | $327,541 |
| 2018 | $5,209 | $388,703 | $61,162 | $327,541 |
| 2017 | $11,867 | $388,703 | $61,162 | $327,541 |
| 2016 | $1,404 | $46,000 | $46,000 | $0 |
| 2015 | $295 | $61,162 | $61,162 | $0 |
| 2014 | $295 | $53,114 | $53,114 | $0 |
Source: Public Records
Map
Nearby Homes
- 18603 Bridle Grove Ct
- 18402 Sierra Falls Ct
- 18803 Dusty Rose Ln
- 12918 Chatfield Manor Ln
- 18522 Cascade Timbers Ln
- 19307 Hillside Pasture Ln
- 20618 Yearling Pasture Ln
- 19243 Palfrey Prairie Trail
- 19219 Palfrey Prairie Trail
- 19326 Palfrey Prairie Trail
- 12719 Rocky Briar Ln
- 18218 Russett Green Dr
- 12414 Montebello Manor Ln
- 12703 Songhollow Dr
- 18903 Danbridge Ct
- 19006 Rustling Ridge Ln
- 18703 Summercliff Ln
- 12327 Northpointe Ridge Ln
- 17623 Edengrove Dr
- 12902 Frontier Creek Ct
- 18703 Tamer View Ct
- 18702 Tamer View Ct
- 18623 Tamer View Ct
- 18706 Tamer View Ct
- 18706 Tamer View Ct
- 18622 Tamer View Ct
- 18707 Tamer View Ct
- 18710 Tamer View Ct
- 18618 Tamer View Ct
- 18711 Tamer View Ct
- 18619 Tamer View Ct
- 18707 Bridle Grove Ct
- 18715 Tamer View Ct
- 18614 Tamer View Ct
- 12906 Arlington Meadows Ln
- 18714 Tamer View Ct
- 18703 Bridle Grove Ct
- 12910 Arlington Meadows Ln
- 12902 Arlington Meadows Ln
- 18711 Bridle Grove Ct