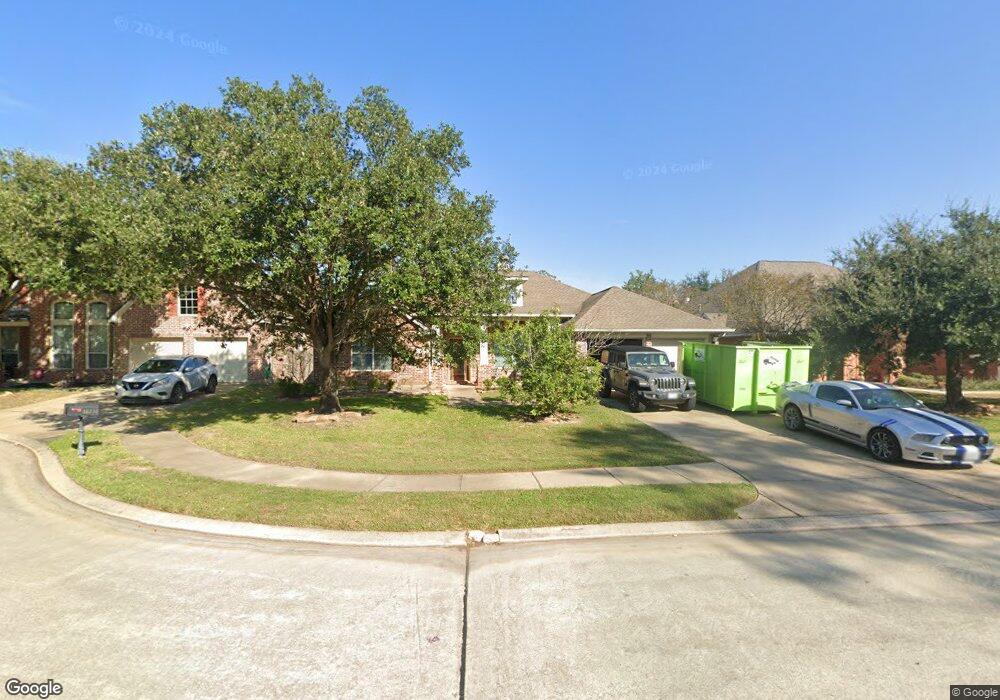
18718 Oxenberg Manor Ln Tomball, TX 77377
Northpointe NeighborhoodEstimated Value: $404,401 - $457,000
4
Beds
3
Baths
2,934
Sq Ft
$145/Sq Ft
Est. Value
About This Home
This home is located at 18718 Oxenberg Manor Ln, Tomball, TX 77377 and is currently estimated at $426,600, approximately $145 per square foot. 18718 Oxenberg Manor Ln is a home located in Harris County with nearby schools including Canyon Pointe Elementary School, Oakcrest Intermediate School, and Tomball Memorial High School.
Ownership History
Date
Name
Owned For
Owner Type
Purchase Details
Closed on
Dec 29, 2011
Sold by
Casey Janice L and Casey Terry S
Bought by
Casey Mary Colleen
Current Estimated Value
Purchase Details
Closed on
Sep 28, 2011
Sold by
Fannie Mae
Bought by
Casey Janice L
Purchase Details
Closed on
Sep 7, 2010
Sold by
Self Strahm Kristina D and Strahm Loren C
Bought by
Federal National Mortgage Association
Purchase Details
Closed on
Nov 14, 2003
Sold by
Weekly Homes Lp
Bought by
Strahm Loren C
Home Financials for this Owner
Home Financials are based on the most recent Mortgage that was taken out on this home.
Original Mortgage
$193,220
Interest Rate
5.93%
Mortgage Type
Purchase Money Mortgage
Create a Home Valuation Report for This Property
The Home Valuation Report is an in-depth analysis detailing your home's value as well as a comparison with similar homes in the area
Home Values in the Area
Average Home Value in this Area
Purchase History
| Date | Buyer | Sale Price | Title Company |
|---|---|---|---|
| Casey Mary Colleen | -- | Old Republic Title | |
| Casey Janice L | -- | Old Republic National Title | |
| Federal National Mortgage Association | $143,698 | None Available | |
| Strahm Loren C | -- | Priority Title Company |
Source: Public Records
Mortgage History
| Date | Status | Borrower | Loan Amount |
|---|---|---|---|
| Previous Owner | Strahm Loren C | $193,220 |
Source: Public Records
Tax History Compared to Growth
Tax History
| Year | Tax Paid | Tax Assessment Tax Assessment Total Assessment is a certain percentage of the fair market value that is determined by local assessors to be the total taxable value of land and additions on the property. | Land | Improvement |
|---|---|---|---|---|
| 2025 | $9,818 | $408,349 | $71,959 | $336,390 |
| 2024 | $9,818 | $390,788 | $71,959 | $318,829 |
| 2023 | $9,818 | $416,458 | $71,959 | $344,499 |
| 2022 | $9,407 | $351,290 | $63,224 | $288,066 |
| 2021 | $7,809 | $279,249 | $54,074 | $225,175 |
| 2020 | $7,833 | $267,456 | $54,074 | $213,382 |
| 2019 | $8,441 | $280,108 | $49,082 | $231,026 |
| 2018 | $3,451 | $257,520 | $49,082 | $208,438 |
| 2017 | $7,862 | $257,520 | $49,082 | $208,438 |
| 2016 | $7,862 | $257,520 | $49,082 | $208,438 |
| 2015 | $5,680 | $257,520 | $49,082 | $208,438 |
| 2014 | $5,680 | $229,020 | $37,436 | $191,584 |
Source: Public Records
Map
Nearby Homes
- 12414 Montebello Manor Ln
- 18703 Summercliff Ln
- 18903 Danbridge Ct
- 18522 Cascade Timbers Ln
- 18803 Dusty Rose Ln
- 18814 Emery Meadows Ln
- 18135 Gravenhurst Ln
- 18603 Bridle Grove Ct
- 12719 Rocky Briar Ln
- 18402 Sierra Falls Ct
- 19307 Hillside Pasture Ln
- 20618 Yearling Pasture Ln
- 19243 Palfrey Prairie Trail
- 19219 Palfrey Prairie Trail
- 19326 Palfrey Prairie Trail
- 12610 Baldwin Springs Ct
- 19006 Rustling Ridge Ln
- 12427 Point Arbor Ct
- 19026 Rustling Ridge Ln
- 12703 Songhollow Dr
- 18714 Oxenberg Manor Ln
- 18722 Oxenberg Manor Ln
- 18719 Peralta Hill Ln
- 18723 Peralta Hill Ln
- 18710 Oxenberg Manor Ln
- 18715 Peralta Hill Ln
- 18726 Oxenberg Manor Ln
- 18727 Peralta Hill Ln
- 18719 Oxenberg Manor Ln
- 18711 Peralta Hill Ln
- 18706 Oxenberg Manor Ln
- 18715 Oxenberg Manor Ln
- 18723 Oxenberg Manor Ln
- 18730 Oxenberg Manor Ln
- 18731 Peralta Hill Ln
- 18727 Oxenberg Manor Ln
- 18711 Oxenberg Manor Ln
- 18707 Peralta Hill Ln
- 18702 Oxenberg Manor Ln
- 18703 Oxenberg Manor Ln