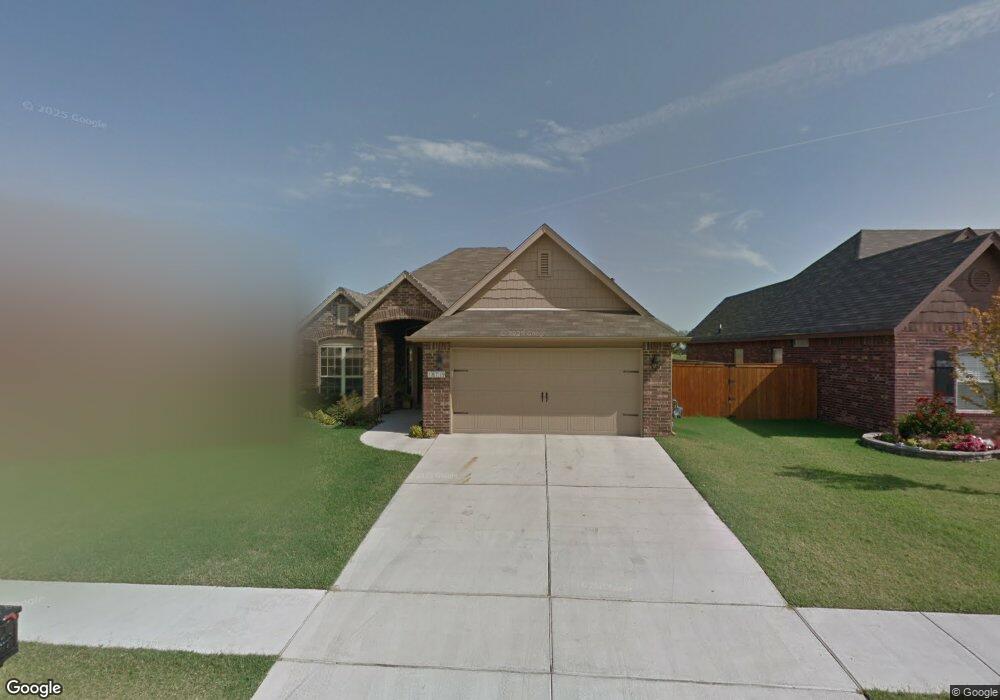
18719 E 47th St Tulsa, OK 74134
Stone Creek Farms NeighborhoodEstimated Value: $255,497 - $282,000
3
Beds
2
Baths
1,441
Sq Ft
$189/Sq Ft
Est. Value
About This Home
This home is located at 18719 E 47th St, Tulsa, OK 74134 and is currently estimated at $272,874, approximately $189 per square foot. 18719 E 47th St is a home located in Tulsa County with nearby schools including Country Lane Primary Elementary School, Country Lane Intermediate School, and Centennial Middle School.
Ownership History
Date
Name
Owned For
Owner Type
Purchase Details
Closed on
Mar 5, 2021
Sold by
Rodriguez Susana R
Bought by
Rodriguez Susana R and Diaz Cristian M
Current Estimated Value
Home Financials for this Owner
Home Financials are based on the most recent Mortgage that was taken out on this home.
Original Mortgage
$91,300
Outstanding Balance
$66,829
Interest Rate
3.1%
Mortgage Type
New Conventional
Estimated Equity
$206,045
Purchase Details
Closed on
Apr 28, 2010
Sold by
Craig Boos Builders Llc
Bought by
Rodriguez Susana R
Home Financials for this Owner
Home Financials are based on the most recent Mortgage that was taken out on this home.
Original Mortgage
$120,800
Interest Rate
5.02%
Mortgage Type
New Conventional
Purchase Details
Closed on
Oct 29, 2009
Sold by
Boos Marjorie L
Bought by
Craig Boos Builders Llc
Home Financials for this Owner
Home Financials are based on the most recent Mortgage that was taken out on this home.
Original Mortgage
$110,200
Interest Rate
5.05%
Mortgage Type
Construction
Create a Home Valuation Report for This Property
The Home Valuation Report is an in-depth analysis detailing your home's value as well as a comparison with similar homes in the area
Home Values in the Area
Average Home Value in this Area
Purchase History
| Date | Buyer | Sale Price | Title Company |
|---|---|---|---|
| Rodriguez Susana R | -- | Title365 | |
| Rodriguez Susana R | $151,000 | Charter Title & Escrow Co Ll | |
| Craig Boos Builders Llc | -- | None Available |
Source: Public Records
Mortgage History
| Date | Status | Borrower | Loan Amount |
|---|---|---|---|
| Open | Rodriguez Susana R | $91,300 | |
| Closed | Rodriguez Susana R | $120,800 | |
| Previous Owner | Craig Boos Builders Llc | $110,200 |
Source: Public Records
Tax History
| Year | Tax Paid | Tax Assessment Tax Assessment Total Assessment is a certain percentage of the fair market value that is determined by local assessors to be the total taxable value of land and additions on the property. | Land | Improvement |
|---|---|---|---|---|
| 2025 | $2,373 | $17,694 | $1,958 | $15,736 |
| 2024 | $2,183 | $17,694 | $2,142 | $15,552 |
| 2023 | $2,183 | $18,150 | $2,141 | $16,009 |
| 2022 | $2,206 | $16,621 | $2,453 | $14,168 |
| 2021 | $2,160 | $16,108 | $2,377 | $13,731 |
| 2020 | $2,084 | $15,610 | $2,719 | $12,891 |
| 2019 | $2,162 | $15,610 | $2,719 | $12,891 |
| 2018 | $2,135 | $15,610 | $2,719 | $12,891 |
| 2017 | $2,130 | $16,610 | $2,893 | $13,717 |
| 2016 | $2,107 | $16,610 | $2,893 | $13,717 |
| 2015 | $2,112 | $16,610 | $2,893 | $13,717 |
| 2014 | $2,112 | $16,610 | $2,893 | $13,717 |
Source: Public Records
Map
Nearby Homes
- 18838 E 47th St
- 4842 S 187th East Ave
- 18609 E 45th St S
- 18305 E 47th St
- 4917 S 190th East Ave
- 5006 S 189th East Ave
- 18628 E 43rd Place
- 18512 E 43rd Place S
- 4239 S 188th East Ave
- 18304 E 43rd St
- 4224 S 185th East Ave
- 4629 S 179th East Ave
- 4809 S 195th East Ave
- 17409 E 44th St S
- 18101 E 42nd Place
- 4310 S 179th East Ave
- 19820 E 45th St S
- 17626 E 48th St
- 4114 S 181st East Ave
- 17715 E 43rd Place S
- 18801 E 47th St
- 18713 E 47th St
- 18807 E 47th St
- 4702 S 188th East Ave
- 18707 E 47th St
- 18701 E 47th St
- 18802 E 47th St
- 4708 S 188th East Ave
- 4703 S 187th East Ave
- 18808 E 47th St
- 18609 E 47th St
- 4709 S 187th East Ave
- 4709 S 187th Ave E
- 18819 E 47th St
- 18618 E 46th Place S
- 18626 E 46th Place S
- 18626 E 46th Place S
- 4714 S 188th East Ave
- 18614 E 46th Place S
- 18825 E 47th St
Your Personal Tour Guide
Ask me questions while you tour the home.