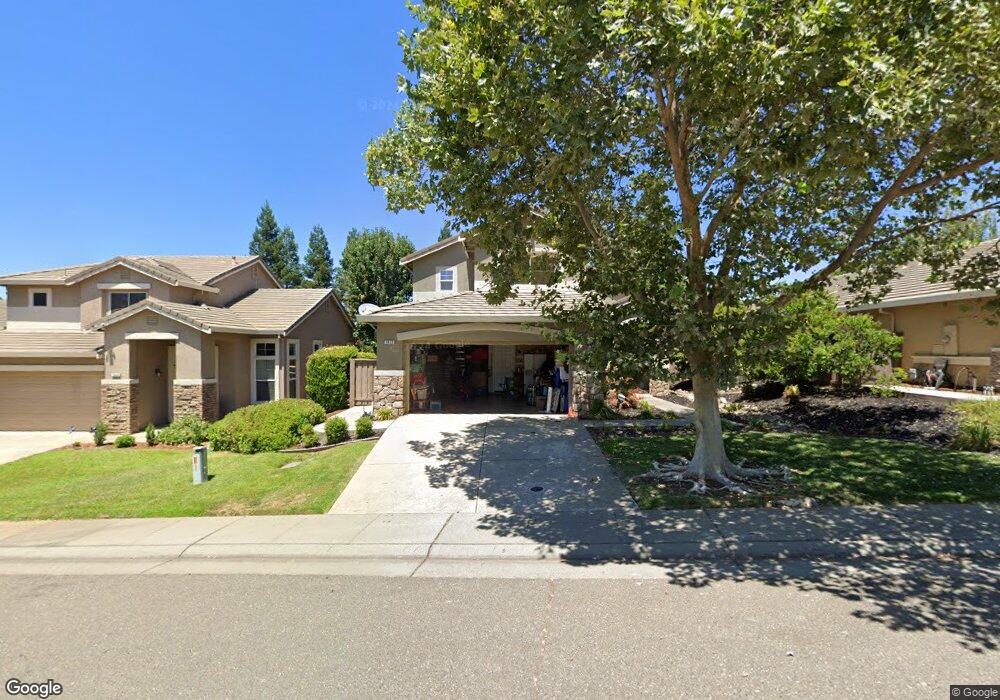
1872 Ardfern Way Folsom, CA 95630
Empire Ranch Village NeighborhoodEstimated Value: $685,000 - $772,000
3
Beds
3
Baths
1,799
Sq Ft
$405/Sq Ft
Est. Value
About This Home
This home is located at 1872 Ardfern Way, Folsom, CA 95630 and is currently estimated at $728,511, approximately $404 per square foot. 1872 Ardfern Way is a home located in Sacramento County with nearby schools including Empire Oaks Elementary School, Folsom Middle School, and Vista Del Lago High School.
Ownership History
Date
Name
Owned For
Owner Type
Purchase Details
Closed on
Sep 29, 2010
Sold by
Beaulieu Timothy D
Bought by
Beaulieu Timothy D
Current Estimated Value
Home Financials for this Owner
Home Financials are based on the most recent Mortgage that was taken out on this home.
Original Mortgage
$333,200
Outstanding Balance
$219,429
Interest Rate
4.31%
Mortgage Type
New Conventional
Estimated Equity
$509,082
Purchase Details
Closed on
Mar 9, 2005
Sold by
Nelson Wayne Paul
Bought by
Beaulieu Timothy D
Home Financials for this Owner
Home Financials are based on the most recent Mortgage that was taken out on this home.
Original Mortgage
$359,000
Interest Rate
5.65%
Mortgage Type
Purchase Money Mortgage
Purchase Details
Closed on
Feb 29, 2000
Sold by
Centex Homes
Bought by
Nelson Wayne P
Home Financials for this Owner
Home Financials are based on the most recent Mortgage that was taken out on this home.
Original Mortgage
$175,200
Interest Rate
8.26%
Create a Home Valuation Report for This Property
The Home Valuation Report is an in-depth analysis detailing your home's value as well as a comparison with similar homes in the area
Home Values in the Area
Average Home Value in this Area
Purchase History
| Date | Buyer | Sale Price | Title Company |
|---|---|---|---|
| Beaulieu Timothy D | -- | Lsi | |
| Beaulieu Timothy D | $469,000 | Stewart Title Of Sacramento | |
| Beaulieu Timothy D | -- | Stewart Title Of Sacramento | |
| Nelson Wayne P | $219,500 | Stewart Title |
Source: Public Records
Mortgage History
| Date | Status | Borrower | Loan Amount |
|---|---|---|---|
| Open | Beaulieu Timothy D | $333,200 | |
| Closed | Beaulieu Timothy D | $359,000 | |
| Previous Owner | Nelson Wayne P | $175,200 |
Source: Public Records
Tax History Compared to Growth
Tax History
| Year | Tax Paid | Tax Assessment Tax Assessment Total Assessment is a certain percentage of the fair market value that is determined by local assessors to be the total taxable value of land and additions on the property. | Land | Improvement |
|---|---|---|---|---|
| 2025 | $8,195 | $653,726 | $195,139 | $458,587 |
| 2024 | $8,195 | $640,909 | $191,313 | $449,596 |
| 2023 | $7,966 | $628,343 | $187,562 | $440,781 |
| 2022 | $7,876 | $616,024 | $183,885 | $432,139 |
| 2021 | $7,796 | $603,946 | $180,280 | $423,666 |
| 2020 | $7,345 | $561,732 | $167,679 | $394,053 |
| 2019 | $7,236 | $542,737 | $162,009 | $380,728 |
| 2018 | $6,920 | $516,894 | $154,295 | $362,599 |
| 2017 | $6,290 | $483,079 | $144,201 | $338,878 |
| 2016 | $6,270 | $451,477 | $134,768 | $316,709 |
| 2015 | $5,985 | $434,113 | $129,585 | $304,528 |
| 2014 | $5,744 | $425,601 | $127,044 | $298,557 |
Source: Public Records
Map
Nearby Homes
- 1164 Brae Ct
- 1120 Clydebank Ln
- 1076 Callander Way
- 1917 Wesley Dr
- 1065 Sandwick Way
- 1046 Smith Way
- 1173 Fergusen Way
- 1838 Belmar Ct
- 3280 Beatty Dr
- 2116 Tarbolton Cir
- 1910 Alteri Ct
- 3040 Vista Lefonti
- 3226 Beatty Dr
- 2581 Capetanios Dr
- 2595 Capetanios Dr
- 1381 Haddington Dr
- 1376 Folsom Meadows Cir N
- 3115 Vista Lefonti
- 1740 Langholm Way
- 8519 Emilia Dr
- 1876 Ardfern Way
- 1868 Ardfern Way
- 1880 Ardfern Way
- 1864 Ardfern Way
- 1873 Greenlaw Way
- 1877 Greenlaw Way
- 1869 Greenlaw Way
- 1884 Ardfern Way
- 1873 Ardfern Way
- 1860 Ardfern Way
- 1869 Ardfern Way
- 1865 Greenlaw Way
- 1877 Ardfern Way
- 1865 Ardfern Way
- 1861 Greenlaw Way
- 1888 Ardfern Way
- 1861 Ardfern Way
- 1857 Greenlaw Way
- 1136 Clydebank Ln
- 1857 Ardfern Way