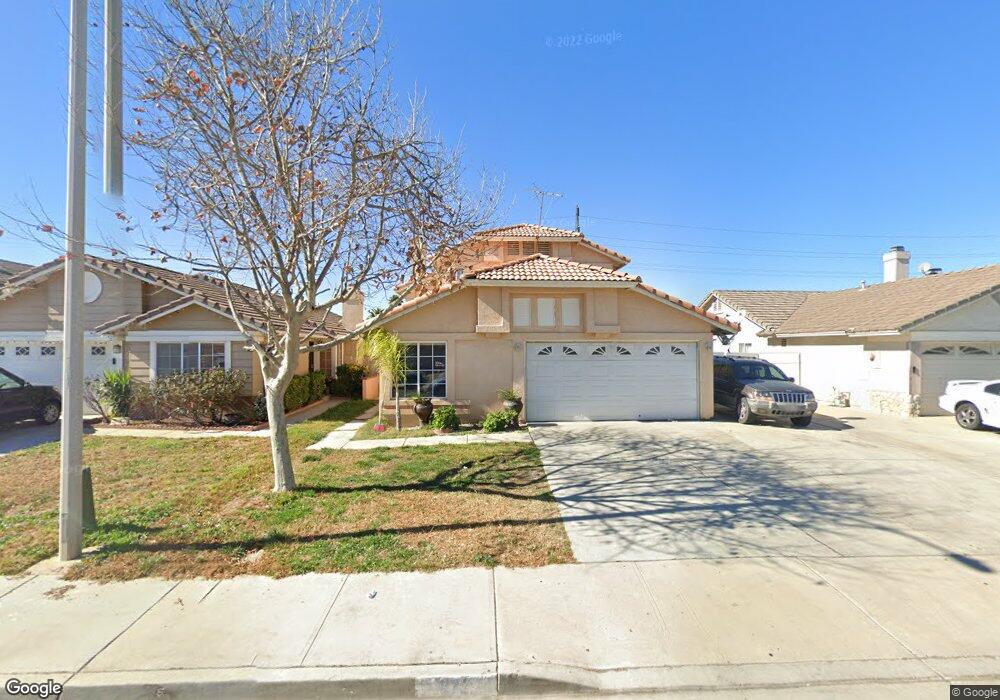
1872 Avenida San Sebastian Perris, CA 92571
Central Perris NeighborhoodEstimated Value: $479,261 - $519,000
3
Beds
3
Baths
1,549
Sq Ft
$322/Sq Ft
Est. Value
About This Home
This home is located at 1872 Avenida San Sebastian, Perris, CA 92571 and is currently estimated at $499,315, approximately $322 per square foot. 1872 Avenida San Sebastian is a home located in Riverside County with nearby schools including Clearwater Elementary School, Pinacate Middle School, and Perris High School.
Ownership History
Date
Name
Owned For
Owner Type
Purchase Details
Closed on
Jul 22, 2011
Sold by
Aurora Loan Services Llc
Bought by
Truong Linda Leen
Current Estimated Value
Purchase Details
Closed on
Mar 4, 2011
Sold by
Serrano Angel and Serrano Selena
Bought by
Aurora Loan Services Llc
Purchase Details
Closed on
Sep 20, 1996
Sold by
Allamby Vernae E and Allamby Erick
Bought by
Serrano Angel and Serrano Selena
Home Financials for this Owner
Home Financials are based on the most recent Mortgage that was taken out on this home.
Original Mortgage
$89,385
Interest Rate
8.3%
Mortgage Type
FHA
Purchase Details
Closed on
Nov 9, 1993
Sold by
Rancho Las Perris Associates Lp
Bought by
Allamby Vernae E
Home Financials for this Owner
Home Financials are based on the most recent Mortgage that was taken out on this home.
Original Mortgage
$110,109
Interest Rate
7.16%
Mortgage Type
VA
Create a Home Valuation Report for This Property
The Home Valuation Report is an in-depth analysis detailing your home's value as well as a comparison with similar homes in the area
Home Values in the Area
Average Home Value in this Area
Purchase History
| Date | Buyer | Sale Price | Title Company |
|---|---|---|---|
| Truong Linda Leen | $120,000 | Lsi Title Company | |
| Aurora Loan Services Llc | $113,000 | None Available | |
| Serrano Angel | $89,500 | Old Republic Title Company | |
| Allamby Vernae E | $110,500 | Stewart Title Co |
Source: Public Records
Mortgage History
| Date | Status | Borrower | Loan Amount |
|---|---|---|---|
| Previous Owner | Serrano Angel | $89,385 | |
| Previous Owner | Allamby Vernae E | $110,109 |
Source: Public Records
Tax History Compared to Growth
Tax History
| Year | Tax Paid | Tax Assessment Tax Assessment Total Assessment is a certain percentage of the fair market value that is determined by local assessors to be the total taxable value of land and additions on the property. | Land | Improvement |
|---|---|---|---|---|
| 2025 | $1,883 | $150,710 | $31,393 | $119,317 |
| 2023 | $1,883 | $144,860 | $30,175 | $114,685 |
| 2022 | $1,861 | $142,021 | $29,584 | $112,437 |
| 2021 | $1,849 | $139,237 | $29,004 | $110,233 |
| 2020 | $1,828 | $137,810 | $28,707 | $109,103 |
| 2019 | $1,789 | $135,109 | $28,145 | $106,964 |
| 2018 | $1,715 | $132,461 | $27,594 | $104,867 |
| 2017 | $2,213 | $129,864 | $27,053 | $102,811 |
| 2016 | $2,238 | $127,319 | $26,523 | $100,796 |
| 2015 | $2,239 | $125,409 | $26,126 | $99,283 |
| 2014 | $2,217 | $122,954 | $25,615 | $97,339 |
Source: Public Records
Map
Nearby Homes
- 1864 Havasu St
- 1753 Jade Ave
- 507 Coudures Way
- 1676 Amethyst Dr
- 1630 Glenview Dr
- 302 Daystar Dr
- 702 Clearwater Dr
- 2138 Star Thistle Ln
- 701 Citrus Ave
- 1671 Ruby Dr
- 487 Lassa Way
- 1562 Remembrance Dr
- 1878 Neptune Dr
- 1529 Arrow Creek Dr
- 2245 Liberty Ct
- 484 Harvest Rd
- 1534 Wilson Ave
- 575 Prairie Way
- 531 Wildwood Ln
- 1462 Apple Creek Dr
- 1878 Avenida San Sebastian
- 1864 Avenida San Sebastian
- 1884 Ave San Sebastian
- 1856 Avenida San Sebastian
- 1890 Ave San Sebastian
- 1890 Avenida San Sebastian
- 1850 Avenida San Sebastian
- 1867 Avenida San Sebastian
- 1867 Avenida San Sebastian
- 1873 Avenida San Sebastian
- 12896 Avenue San Sebastian
- 1861 Ave San Sebastian
- 1844 Avenida San Sebastian
- 1861 Avenida San Sebastian
- 1879 Ave San Sebastian
- 1879 Avenida San Sebastian
- 1855 Ave San Sebastian
- 1855 Avenida San Sebastian
- 1885 Avenida San Sebastian
- 1904 Avenida San Sebastian