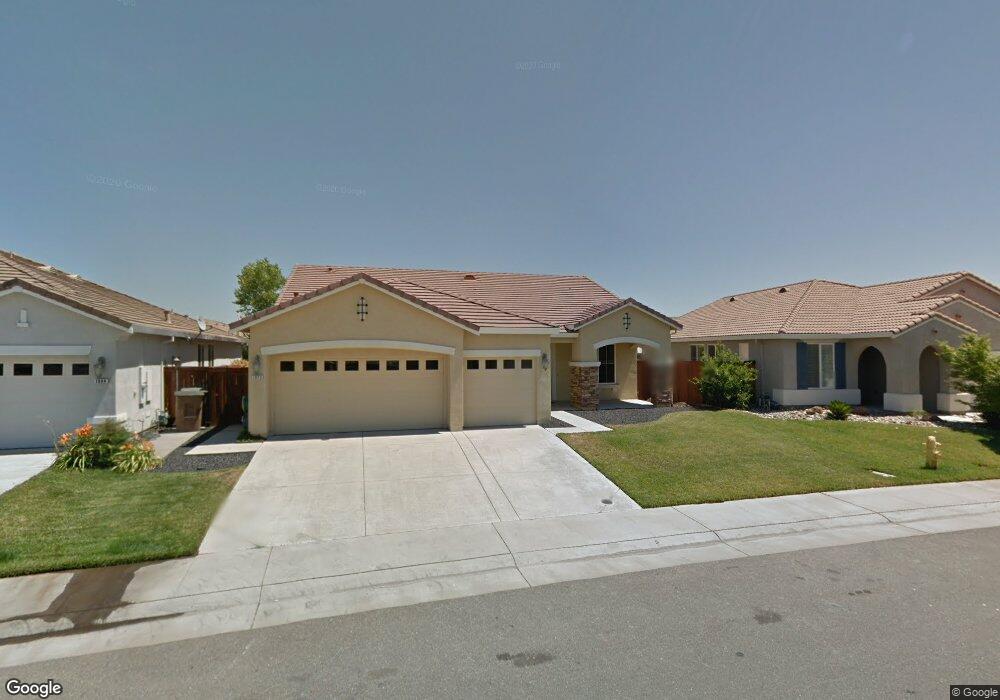
1872 Delouch Dr Lincoln, CA 95648
Estimated Value: $625,454 - $661,000
3
Beds
2
Baths
2,190
Sq Ft
$293/Sq Ft
Est. Value
About This Home
This home is located at 1872 Delouch Dr, Lincoln, CA 95648 and is currently estimated at $641,114, approximately $292 per square foot. 1872 Delouch Dr is a home located in Placer County with nearby schools including Lincoln Crossing Elementary, Twelve Bridges Middle School, and John Adams Academy - Lincoln.
Ownership History
Date
Name
Owned For
Owner Type
Purchase Details
Closed on
Nov 17, 2009
Sold by
Fannie Mae
Bought by
Mortimer Joshua K and Mortimer Catherine L
Current Estimated Value
Home Financials for this Owner
Home Financials are based on the most recent Mortgage that was taken out on this home.
Original Mortgage
$255,290
Outstanding Balance
$165,668
Interest Rate
4.88%
Mortgage Type
FHA
Estimated Equity
$475,446
Purchase Details
Closed on
Jul 8, 2009
Sold by
Vandiver Jeff
Bought by
Federal National Mortgage Association
Purchase Details
Closed on
May 12, 2006
Sold by
Centex Homes
Bought by
Vandiver Jeff
Home Financials for this Owner
Home Financials are based on the most recent Mortgage that was taken out on this home.
Original Mortgage
$395,000
Interest Rate
6.37%
Mortgage Type
Fannie Mae Freddie Mac
Create a Home Valuation Report for This Property
The Home Valuation Report is an in-depth analysis detailing your home's value as well as a comparison with similar homes in the area
Home Values in the Area
Average Home Value in this Area
Purchase History
| Date | Buyer | Sale Price | Title Company |
|---|---|---|---|
| Mortimer Joshua K | $260,000 | Landsafe Title | |
| Federal National Mortgage Association | $421,477 | Fidelity Natl Title Ins Co | |
| Vandiver Jeff | $494,000 | Commerce Title Company |
Source: Public Records
Mortgage History
| Date | Status | Borrower | Loan Amount |
|---|---|---|---|
| Open | Mortimer Joshua K | $255,290 | |
| Previous Owner | Vandiver Jeff | $395,000 |
Source: Public Records
Tax History Compared to Growth
Tax History
| Year | Tax Paid | Tax Assessment Tax Assessment Total Assessment is a certain percentage of the fair market value that is determined by local assessors to be the total taxable value of land and additions on the property. | Land | Improvement |
|---|---|---|---|---|
| 2025 | $5,126 | $357,217 | $51,627 | $305,590 |
| 2023 | $5,126 | $343,348 | $49,623 | $293,725 |
| 2022 | $4,983 | $336,616 | $48,650 | $287,966 |
| 2021 | $4,889 | $330,017 | $47,697 | $282,320 |
| 2020 | $4,862 | $326,634 | $47,208 | $279,426 |
| 2019 | $4,758 | $320,231 | $46,283 | $273,948 |
| 2018 | $4,458 | $294,953 | $45,376 | $249,577 |
| 2017 | $4,344 | $289,171 | $44,487 | $244,684 |
| 2016 | $4,258 | $283,502 | $43,615 | $239,887 |
| 2015 | $4,182 | $279,244 | $42,960 | $236,284 |
| 2014 | $4,098 | $273,775 | $42,119 | $231,656 |
Source: Public Records
Map
Nearby Homes
- 660 Mazzolo Dr
- 662 Tara Bella Dr
- 305 Dedham Ct
- 1237 Portello Way
- 946 Devonshire Ln
- 1988 Lucca Ln
- 2249 Comstock Ln
- 1512 Citrus St
- 1834 Salerno Place
- 1842 Salerno Place
- 822 Courtyards Loop
- 668 Whitfield Ln
- 838 Farrington Ln
- 112 Douglas Dr
- 1270 Incline Dr Unit 3
- 2000 Sierra View Cir Unit 1
- 1456 Regent Cir
- 1624 Midford Ln
- 1483 Regent Cir
- 339 Reeves Ct
- 1884 Delouch Dr
- 1860 Delouch Dr
- 651 Toad Hollow Dr
- 1887 Delouch Dr
- 1875 Delouch Dr
- 1653 Portello Way
- 1685 Portello Way
- 1899 Delouch Dr
- 1848 Delouch Dr
- 1637 Portello Way
- 643 Toad Hollow Dr
- 1863 Delouch Dr
- 635 Toad Hollow Dr
- 627 Toad Hollow Dr
- 1621 Portello Way
- 1911 Delouch Dr
- 1851 Delouch Dr
- 1605 Portello Way
- 656 Toad Hollow Dr
- 648 Toad Hollow Dr