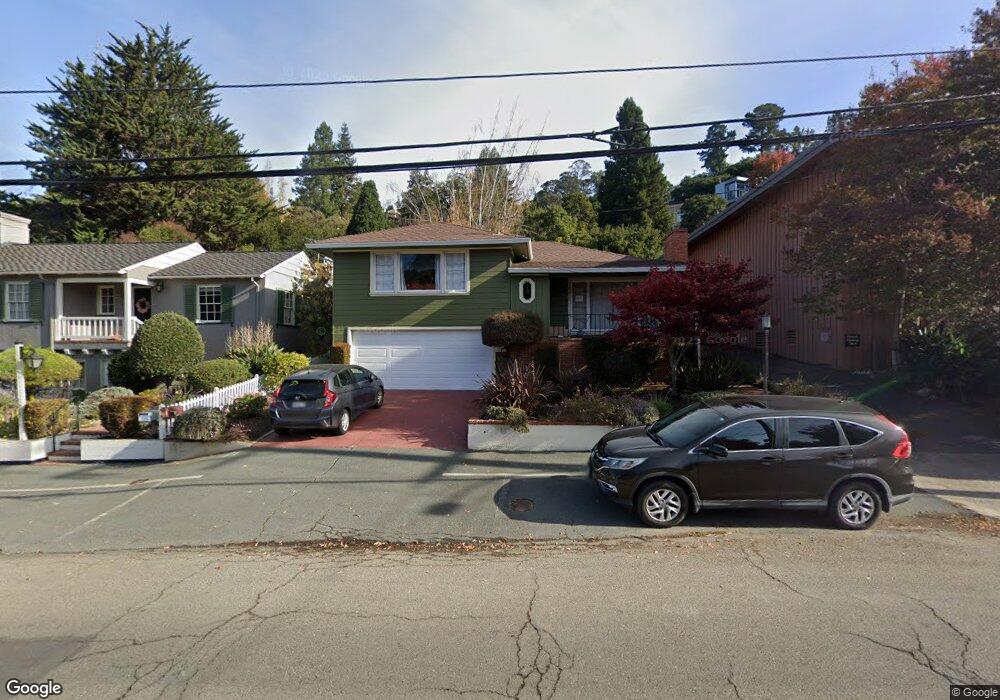
1872 Mountain Blvd Oakland, CA 94611
Montclair NeighborhoodEstimated Value: $1,082,000 - $1,252,000
2
Beds
2
Baths
1,680
Sq Ft
$702/Sq Ft
Est. Value
About This Home
This home is located at 1872 Mountain Blvd, Oakland, CA 94611 and is currently estimated at $1,179,541, approximately $702 per square foot. 1872 Mountain Blvd is a home located in Alameda County with nearby schools including Montclair Elementary School, Montera Middle School, and Skyline High School.
Ownership History
Date
Name
Owned For
Owner Type
Purchase Details
Closed on
Dec 5, 2007
Sold by
Fong Sherman and Fong Fremont
Bought by
Fong David T and Fong Susana C
Current Estimated Value
Home Financials for this Owner
Home Financials are based on the most recent Mortgage that was taken out on this home.
Original Mortgage
$400,000
Outstanding Balance
$253,183
Interest Rate
6.3%
Mortgage Type
Purchase Money Mortgage
Estimated Equity
$926,358
Purchase Details
Closed on
Mar 28, 2005
Sold by
Fong Sherman and Fong Fremont
Bought by
Fong Sherman and Fong Fremont
Home Financials for this Owner
Home Financials are based on the most recent Mortgage that was taken out on this home.
Original Mortgage
$400,000
Interest Rate
4.79%
Mortgage Type
Negative Amortization
Purchase Details
Closed on
Jun 25, 2000
Sold by
Fong Sherman and Fong Fremont
Bought by
Fong Sherman and Fong Fremont
Create a Home Valuation Report for This Property
The Home Valuation Report is an in-depth analysis detailing your home's value as well as a comparison with similar homes in the area
Home Values in the Area
Average Home Value in this Area
Purchase History
| Date | Buyer | Sale Price | Title Company |
|---|---|---|---|
| Fong David T | $500,000 | Chicago Title Company | |
| Fong Sherman | -- | Placer Title Company | |
| Fong Sherman | -- | -- |
Source: Public Records
Mortgage History
| Date | Status | Borrower | Loan Amount |
|---|---|---|---|
| Open | Fong David T | $400,000 | |
| Previous Owner | Fong Sherman | $400,000 |
Source: Public Records
Tax History Compared to Growth
Tax History
| Year | Tax Paid | Tax Assessment Tax Assessment Total Assessment is a certain percentage of the fair market value that is determined by local assessors to be the total taxable value of land and additions on the property. | Land | Improvement |
|---|---|---|---|---|
| 2025 | $11,752 | $794,227 | $245,292 | $555,935 |
| 2024 | $11,752 | $778,519 | $240,483 | $545,036 |
| 2023 | $12,354 | $770,123 | $235,770 | $534,353 |
| 2022 | $12,048 | $748,024 | $231,147 | $523,877 |
| 2021 | $11,568 | $733,225 | $226,617 | $513,608 |
| 2020 | $11,440 | $732,636 | $224,293 | $508,343 |
| 2019 | $11,041 | $718,276 | $219,897 | $498,379 |
| 2018 | $10,807 | $704,197 | $215,587 | $488,610 |
| 2017 | $10,405 | $690,391 | $211,360 | $479,031 |
| 2016 | $10,090 | $676,855 | $207,216 | $469,639 |
| 2015 | $10,037 | $666,692 | $204,105 | $462,587 |
| 2014 | $10,151 | $653,637 | $200,108 | $453,529 |
Source: Public Records
Map
Nearby Homes
- 5909 Colton Blvd
- 5969 Bruns Ct
- 0 Bullard Dr
- 0 Thornhill Dr
- 6425 Zinn Dr
- 5716 Merriewood Dr
- 0 Colton Blvd
- 1801 Gouldin Rd
- 2066 Drake Dr
- 6687 Thornhill Dr
- 0 Woodrow Dr Unit 41109468
- 5673 Florence Terrace
- 5663 Florence Terrace
- 7580 Skyline Blvd
- 3 West Cir
- 21 Tyson Cir
- 0 Gouldin Rd Unit 41077349
- 5630 Moraga Ave
- 6801 Estates Dr
- 5555 Moraga Ave
- 1866 Mountain Blvd
- 5625 Colton Blvd
- 1858 Mountain Blvd
- 5635 Colton Blvd
- 5645 Colton Blvd
- 1850 Mountain Blvd
- 5651 Colton Blvd
- 5600 Cabot Dr
- 5608 Colton Blvd
- 5628 Colton Blvd
- 5614 Colton Blvd
- 5620 Colton Blvd
- 5657 Colton Blvd
- 5600 Colton Blvd
- 5618 Cabot Dr
- 1833 Magellan Dr
- 1832 Mountain Blvd
- 5665 Colton Blvd
- 5650 Colton Blvd
- 5624 Cabot Dr