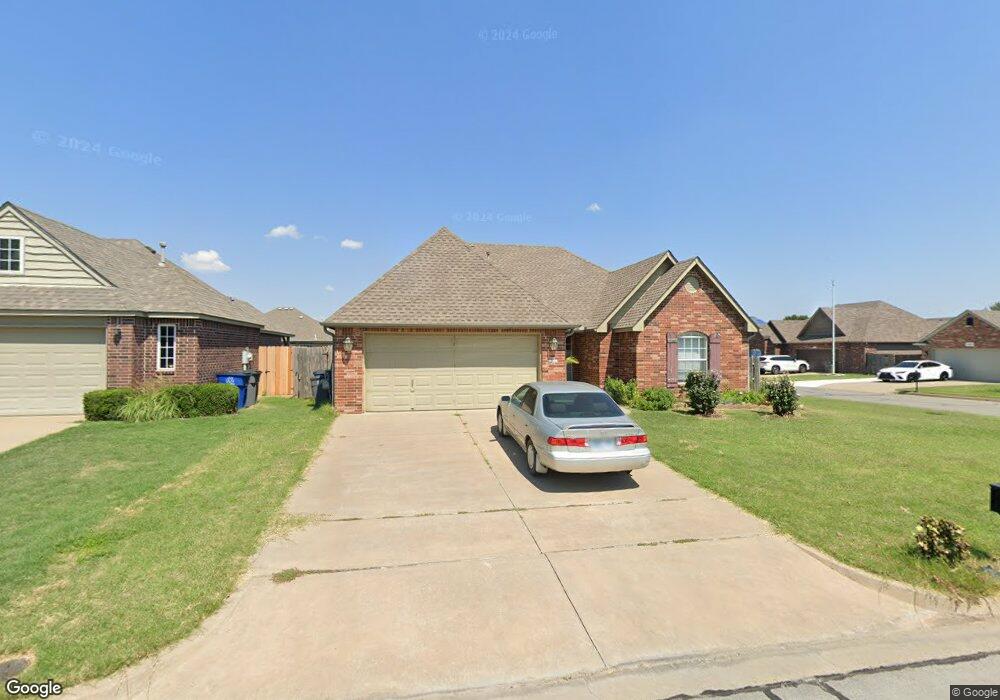
18729 E 49th Place Tulsa, OK 74134
Stone Creek Farms NeighborhoodEstimated Value: $286,989 - $295,000
3
Beds
2
Baths
1,782
Sq Ft
$163/Sq Ft
Est. Value
About This Home
This home is located at 18729 E 49th Place, Tulsa, OK 74134 and is currently estimated at $290,247, approximately $162 per square foot. 18729 E 49th Place is a home located in Tulsa County with nearby schools including Country Lane Primary Elementary School, Country Lane Intermediate School, and Centennial Middle School.
Ownership History
Date
Name
Owned For
Owner Type
Purchase Details
Closed on
Jan 8, 2018
Sold by
Pham Truc D and Nguyen Tuan M
Bought by
Pham Dinh V and Dao Loi T
Current Estimated Value
Purchase Details
Closed on
Jan 26, 2012
Sold by
Pham Truc D and Nguyen Tuan N
Bought by
Pham Truc D and Nguyen Tuan N
Purchase Details
Closed on
Nov 9, 2011
Sold by
Brecht Raymond R and Brecht Maria
Bought by
Pham Truc D and Nguyen Tuan N
Home Financials for this Owner
Home Financials are based on the most recent Mortgage that was taken out on this home.
Original Mortgage
$117,600
Outstanding Balance
$79,836
Interest Rate
4.08%
Mortgage Type
New Conventional
Estimated Equity
$210,411
Purchase Details
Closed on
Jun 12, 2007
Sold by
Mike Fretz Inc
Bought by
Brecht Raymond R and Brecht Maria
Home Financials for this Owner
Home Financials are based on the most recent Mortgage that was taken out on this home.
Original Mortgage
$35,000
Interest Rate
6.15%
Mortgage Type
Purchase Money Mortgage
Create a Home Valuation Report for This Property
The Home Valuation Report is an in-depth analysis detailing your home's value as well as a comparison with similar homes in the area
Home Values in the Area
Average Home Value in this Area
Purchase History
| Date | Buyer | Sale Price | Title Company |
|---|---|---|---|
| Pham Dinh V | -- | None Available | |
| Pham Truc D | -- | Firstitle & Abstract Service | |
| Pham Truc D | $147,000 | Firstitle & Abstract Service | |
| Brecht Raymond R | $160,000 | Frisco Title Corporation |
Source: Public Records
Mortgage History
| Date | Status | Borrower | Loan Amount |
|---|---|---|---|
| Open | Pham Truc D | $117,600 | |
| Previous Owner | Brecht Raymond R | $35,000 |
Source: Public Records
Tax History
| Year | Tax Paid | Tax Assessment Tax Assessment Total Assessment is a certain percentage of the fair market value that is determined by local assessors to be the total taxable value of land and additions on the property. | Land | Improvement |
|---|---|---|---|---|
| 2025 | $3,005 | $22,410 | $2,467 | $19,943 |
| 2024 | $2,682 | $21,728 | $2,551 | $19,177 |
| 2023 | $2,682 | $22,066 | $2,543 | $19,523 |
| 2022 | $2,710 | $20,423 | $3,003 | $17,420 |
| 2021 | $2,654 | $19,799 | $2,911 | $16,888 |
| 2020 | $2,563 | $19,194 | $2,927 | $16,267 |
| 2019 | $2,577 | $18,605 | $2,837 | $15,768 |
| 2018 | $2,466 | $18,034 | $2,750 | $15,284 |
| 2017 | $2,522 | $18,480 | $2,818 | $15,662 |
| 2016 | $2,376 | $17,600 | $3,146 | $14,454 |
| 2015 | $2,381 | $17,600 | $3,146 | $14,454 |
| 2014 | $2,382 | $17,600 | $3,146 | $14,454 |
Source: Public Records
Map
Nearby Homes
- 18709 E 49th Place S
- 18918 E 49th Place
- 4917 S 190th East Ave
- 18204 E 48th Place
- 18305 E 47th St
- 19405 E 48th St S
- 18609 E 45th St S
- 17065 E 45th St S
- 4809 S 195th East Ave
- 18628 E 43rd Place
- 18512 E 43rd Place S
- 4629 S 179th East Ave
- 5012 S 195th East Ct
- 18304 E 43rd St
- 4239 S 188th East Ave
- 4224 S 185th East Ave
- 17409 E 44th St S
- 17626 E 48th St
- 5024 S 197th East Ave
- 19820 E 45th St S
- 18725 E 49th Place
- 18730 E 49th St
- 18721 E 49th Place
- 18726 E 49th St
- 4915 S 188th Ave E
- 4919 S 188th East Ave
- 4915 S 188th East Ave
- 4923 S 188th East Ave
- 18722 E 49th St
- 18726 E 49th Place
- 18717 E 49th Place
- 4911 S 188th East Ave
- 4927 S 188th East Ave
- 18722 E 49th Place
- 18718 E 49th St
- 4907 S 188th East Ave
- 18713 E 49th Place
- 4931 S 188th East Ave
- 18718 E 49th Place
- 18714 E 49th St
Your Personal Tour Guide
Ask me questions while you tour the home.