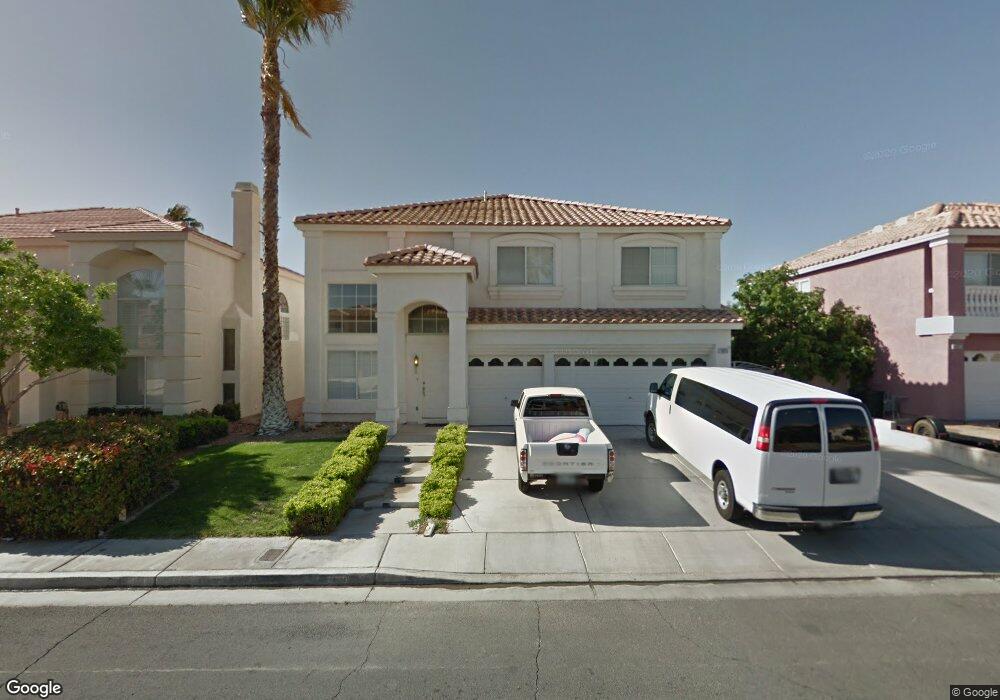
1875 Sky Flower Ct Unit 3 Las Vegas, NV 89123
Silverado Ranch NeighborhoodEstimated Value: $623,000 - $676,000
5
Beds
3
Baths
2,968
Sq Ft
$219/Sq Ft
Est. Value
About This Home
This home is located at 1875 Sky Flower Ct Unit 3, Las Vegas, NV 89123 and is currently estimated at $650,815, approximately $219 per square foot. 1875 Sky Flower Ct Unit 3 is a home located in Clark County with nearby schools including Roberta C Cartwright Elementary School, Charles Silvestri Junior High School, and Silverado High School.
Ownership History
Date
Name
Owned For
Owner Type
Purchase Details
Closed on
Nov 5, 2002
Sold by
Homeside Lending Inc
Bought by
Gerber Glenn and Gerber Eva
Current Estimated Value
Home Financials for this Owner
Home Financials are based on the most recent Mortgage that was taken out on this home.
Original Mortgage
$259,350
Outstanding Balance
$108,070
Interest Rate
5.95%
Estimated Equity
$542,745
Purchase Details
Closed on
Jan 31, 2002
Sold by
Va
Bought by
Homeside Lending Inc
Purchase Details
Closed on
Sep 18, 2001
Sold by
Homeside Lending Inc
Bought by
Va
Purchase Details
Closed on
Apr 9, 1997
Sold by
American West Homes Inc
Bought by
Scott James T and Scott Sherri L
Home Financials for this Owner
Home Financials are based on the most recent Mortgage that was taken out on this home.
Original Mortgage
$192,301
Interest Rate
7.66%
Mortgage Type
VA
Create a Home Valuation Report for This Property
The Home Valuation Report is an in-depth analysis detailing your home's value as well as a comparison with similar homes in the area
Home Values in the Area
Average Home Value in this Area
Purchase History
| Date | Buyer | Sale Price | Title Company |
|---|---|---|---|
| Gerber Glenn | $245,000 | Fidelity National Title | |
| Homeside Lending Inc | $198,293 | -- | |
| Va | $198,293 | -- | |
| Homeside Lending Inc | $198,293 | Fidelity National Title | |
| Scott James T | $187,000 | First American Title Co |
Source: Public Records
Mortgage History
| Date | Status | Borrower | Loan Amount |
|---|---|---|---|
| Open | Gerber Glenn | $259,350 | |
| Previous Owner | Scott James T | $192,301 |
Source: Public Records
Tax History Compared to Growth
Tax History
| Year | Tax Paid | Tax Assessment Tax Assessment Total Assessment is a certain percentage of the fair market value that is determined by local assessors to be the total taxable value of land and additions on the property. | Land | Improvement |
|---|---|---|---|---|
| 2025 | $3,624 | $159,578 | $49,350 | $110,228 |
| 2024 | $3,356 | $159,578 | $49,350 | $110,228 |
| 2023 | $3,356 | $150,593 | $46,200 | $104,393 |
| 2022 | $3,108 | $134,292 | $38,500 | $95,792 |
| 2021 | $2,878 | $123,365 | $32,200 | $91,165 |
| 2020 | $2,670 | $122,023 | $31,500 | $90,523 |
| 2019 | $2,502 | $118,173 | $28,700 | $89,473 |
| 2018 | $2,387 | $110,384 | $24,500 | $85,884 |
| 2017 | $3,280 | $111,844 | $24,500 | $87,344 |
| 2016 | $2,235 | $105,235 | $18,200 | $87,035 |
| 2015 | $2,230 | $88,968 | $12,950 | $76,018 |
| 2014 | $2,165 | $71,625 | $10,500 | $61,125 |
Source: Public Records
Map
Nearby Homes
- 9620 Orchid Bay Dr
- 1846 Autumn Gold Ave
- 1704 Silver Point Ave
- 9560 Summerfest St
- 1690 Silver Rain Ave
- 1905 Bocale Ct
- 1647 Silver Knoll Ave
- 1680 Sweet Pea Ave
- 9793 Silver Lasso St
- 1549 Silver Glen Ave
- 1945 Bova Matrina Ct
- 2300 E Silverado Ranch Blvd Unit 2112
- 2300 E Silverado Ranch Blvd Unit 2033
- 2300 E Silverado Ranch Blvd Unit 2161
- 2300 E Silverado Ranch Blvd Unit 1080
- 2300 E Silverado Ranch Blvd Unit 1106
- 2300 E Silverado Ranch Blvd Unit 2196
- 2300 E Silverado Ranch Blvd Unit 2158
- 2300 E Silverado Ranch Blvd Unit 1074
- 2300 E Silverado Ranch Blvd Unit 1180
- 1889 Sky Flower Ct
- 1861 Sky Flower Ct
- 1874 Wild Indigo Ct
- 1888 Wild Indigo Ct
- 1860 Wild Indigo Ct
- 1847 Sky Flower Ct Unit 3
- 1903 Sky Flower Ct
- 1866 Sky Flower Ct
- 1882 Sky Flower Ct
- 1902 Wild Indigo Ct
- 1846 Wild Indigo Ct
- 1850 Sky Flower Ct
- 1833 Sky Flower Ct
- 1902 Sky Flower Ct
- 1832 Wild Indigo Ct
- 1834 Sky Flower Ct
- 1875 Wild Indigo Ct
- 1889 Wild Indigo Ct
- 1819 Sky Flower Ct
- 1861 Wild Indigo Ct