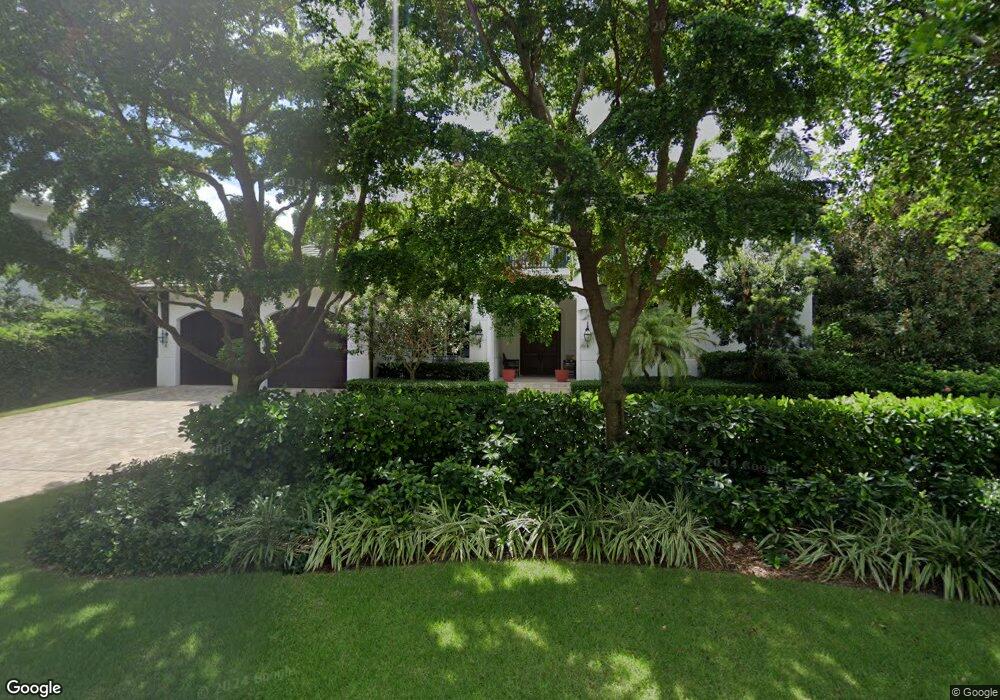
1876 5th St S Unit 6 Naples, FL 34102
Aqualane Shores NeighborhoodEstimated Value: $5,954,295 - $8,975,000
5
Beds
8
Baths
6,067
Sq Ft
$1,222/Sq Ft
Est. Value
About This Home
This home is located at 1876 5th St S Unit 6, Naples, FL 34102 and is currently estimated at $7,415,432, approximately $1,222 per square foot. 1876 5th St S Unit 6 is a home located in Collier County with nearby schools including Lake Park Elementary School, Naples High School, and Gulfview Middle School.
Ownership History
Date
Name
Owned For
Owner Type
Purchase Details
Closed on
Jan 15, 2026
Sold by
Resch David A and Resch Carol L
Bought by
Carol L Resch Revocable Trust and Resch
Current Estimated Value
Purchase Details
Closed on
Aug 19, 2011
Sold by
Stonegate Bank
Bought by
Resch David A and Resch Carol L
Purchase Details
Closed on
Jul 29, 2011
Sold by
Park Edward C
Bought by
Stonegate Bank
Purchase Details
Closed on
Mar 12, 2008
Sold by
Clark Carl W and Clark Suzanne W
Bought by
Park Edward C
Home Financials for this Owner
Home Financials are based on the most recent Mortgage that was taken out on this home.
Original Mortgage
$1,360,000
Interest Rate
5.63%
Mortgage Type
Purchase Money Mortgage
Purchase Details
Closed on
Aug 6, 1996
Sold by
Elwood Thomas P and Elwood Marylin W
Bought by
Clark Carl W and Clark Suzanne W
Home Financials for this Owner
Home Financials are based on the most recent Mortgage that was taken out on this home.
Original Mortgage
$380,000
Interest Rate
8.12%
Mortgage Type
Purchase Money Mortgage
Create a Home Valuation Report for This Property
The Home Valuation Report is an in-depth analysis detailing your home's value as well as a comparison with similar homes in the area
Home Values in the Area
Average Home Value in this Area
Purchase History
| Date | Buyer | Sale Price | Title Company |
|---|---|---|---|
| Carol L Resch Revocable Trust | -- | None Listed On Document | |
| Resch David A | $1,275,000 | Attorney | |
| Stonegate Bank | $1,360,000 | Attorney | |
| Park Edward C | $1,225,000 | Attorney | |
| Clark Carl W | $525,000 | -- |
Source: Public Records
Mortgage History
| Date | Status | Borrower | Loan Amount |
|---|---|---|---|
| Previous Owner | Park Edward C | $1,360,000 | |
| Previous Owner | Clark Carl W | $380,000 |
Source: Public Records
Tax History
| Year | Tax Paid | Tax Assessment Tax Assessment Total Assessment is a certain percentage of the fair market value that is determined by local assessors to be the total taxable value of land and additions on the property. | Land | Improvement |
|---|---|---|---|---|
| 2025 | $30,939 | $3,531,815 | -- | -- |
| 2024 | $30,481 | $3,432,279 | -- | -- |
| 2023 | $30,481 | $3,332,310 | $0 | $0 |
| 2022 | $31,347 | $3,235,252 | $0 | $0 |
| 2021 | $31,840 | $3,141,021 | $0 | $0 |
| 2020 | $31,064 | $3,097,654 | $0 | $0 |
| 2019 | $30,691 | $3,028,010 | $0 | $0 |
| 2018 | $30,055 | $2,971,551 | $0 | $0 |
| 2017 | $29,601 | $2,910,432 | $0 | $0 |
| 2016 | $29,106 | $2,850,570 | $0 | $0 |
| 2015 | $29,715 | $2,830,755 | $0 | $0 |
| 2014 | $30,168 | $2,758,289 | $0 | $0 |
Source: Public Records
Map
Nearby Homes
- 442 18th Ave S
- 1935 5th St S
- 453 18th Ave S
- 1979 4th St S
- 470 17th Ave S
- 2001 4th St S
- 2020 5th St S
- 0 Keewaydin Unit 2252009
- 0 Keewaydin Unit 225075140
- 611 18th Ave S
- 575 17th Ave S
- 601 17th Ave S
- 481 21st Ave S
- 508 16th Ave S
- 408 16th Ave S
- 1990 7th St S
- 608 16th Ave S
- 625 21st Ave S
- 2471 NE 16th Ave S
- 461 16th Ave S
- 1900 5th St S
- 470 18th Ave S
- 450 18th Ave S
- 1881 5th St S
- 1922 5th St S
- 1851 5th St S
- 1911 5th St S
- 2830 SE 18 Ave
- XX SE 18 Ave
- 18 ave NE #23
- 442 18th Ave S Unit 9
- 00 18th Ave S
- 1 18th Ave S
- TRACT 24 UNIT 87 18th Ave S
- 640 18th Ave S
- 352600 18th Ave S
- 347500 18th Ave S
- 001 18th Ave S
- 1825 5th St S
- 1956 5th St S
Your Personal Tour Guide
Ask me questions while you tour the home.