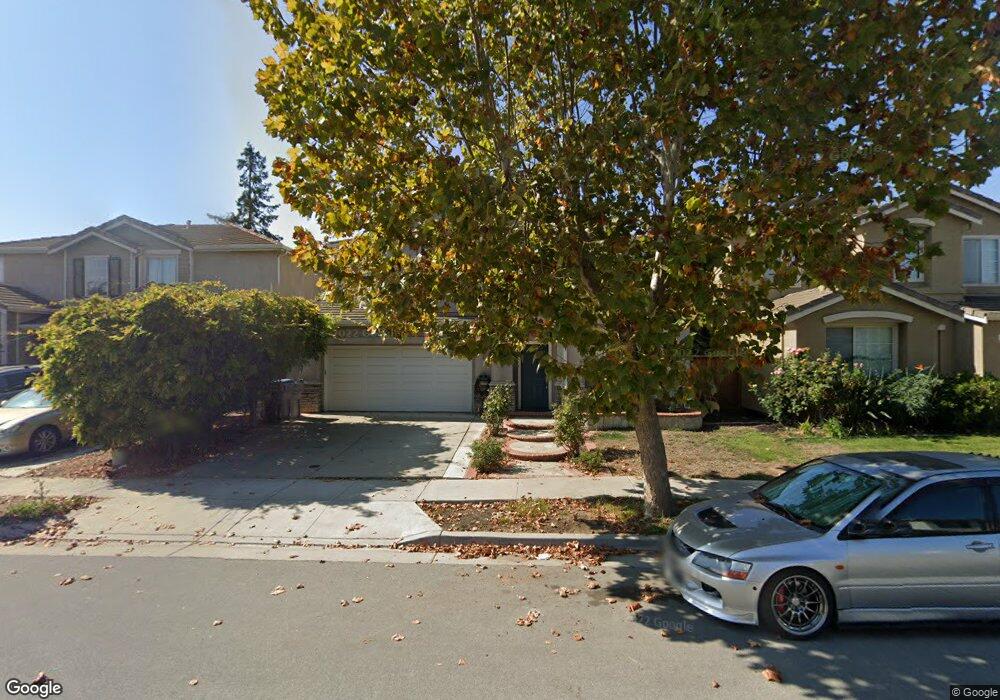
1878 Fumia Place San Jose, CA 95131
Estimated Value: $2,098,000 - $2,182,000
4
Beds
3
Baths
2,464
Sq Ft
$873/Sq Ft
Est. Value
About This Home
This home is located at 1878 Fumia Place, San Jose, CA 95131 and is currently estimated at $2,149,988, approximately $872 per square foot. 1878 Fumia Place is a home located in Santa Clara County with nearby schools including Orchard Elementary School, Independence High School, and Challenger School - Berryessa.
Ownership History
Date
Name
Owned For
Owner Type
Purchase Details
Closed on
Jun 8, 2011
Sold by
Singian Rodolfo P and Singian Abigail
Bought by
Liu Chunbo and Zhu Yan
Current Estimated Value
Home Financials for this Owner
Home Financials are based on the most recent Mortgage that was taken out on this home.
Original Mortgage
$532,500
Outstanding Balance
$351,573
Interest Rate
3.75%
Mortgage Type
New Conventional
Estimated Equity
$1,798,415
Purchase Details
Closed on
Nov 10, 2004
Sold by
Pham Billy and Pham Thao Mai
Bought by
Singian Rodolfo P and Singian Abigail
Home Financials for this Owner
Home Financials are based on the most recent Mortgage that was taken out on this home.
Original Mortgage
$636,000
Interest Rate
3.94%
Mortgage Type
Negative Amortization
Purchase Details
Closed on
May 1, 1998
Sold by
Kaufman & Broad South Bay Inc
Bought by
Pham Billy and Pham Thao Mai
Home Financials for this Owner
Home Financials are based on the most recent Mortgage that was taken out on this home.
Original Mortgage
$290,000
Interest Rate
7.13%
Create a Home Valuation Report for This Property
The Home Valuation Report is an in-depth analysis detailing your home's value as well as a comparison with similar homes in the area
Home Values in the Area
Average Home Value in this Area
Purchase History
| Date | Buyer | Sale Price | Title Company |
|---|---|---|---|
| Liu Chunbo | $710,000 | Orange Coast Title | |
| Singian Rodolfo P | $795,000 | Fidelity National Title Ins | |
| Pham Billy | $398,000 | First American Title Guarant |
Source: Public Records
Mortgage History
| Date | Status | Borrower | Loan Amount |
|---|---|---|---|
| Open | Liu Chunbo | $532,500 | |
| Previous Owner | Singian Rodolfo P | $636,000 | |
| Previous Owner | Pham Billy | $290,000 | |
| Closed | Singian Rodolfo P | $39,750 |
Source: Public Records
Tax History Compared to Growth
Tax History
| Year | Tax Paid | Tax Assessment Tax Assessment Total Assessment is a certain percentage of the fair market value that is determined by local assessors to be the total taxable value of land and additions on the property. | Land | Improvement |
|---|---|---|---|---|
| 2025 | $12,401 | $909,621 | $500,293 | $409,328 |
| 2024 | $12,401 | $891,786 | $490,484 | $401,302 |
| 2023 | $12,126 | $874,301 | $480,867 | $393,434 |
| 2022 | $12,051 | $857,159 | $471,439 | $385,720 |
| 2021 | $11,832 | $840,353 | $462,196 | $378,157 |
| 2020 | $11,518 | $831,737 | $457,457 | $374,280 |
| 2019 | $11,290 | $815,430 | $448,488 | $366,942 |
| 2018 | $11,156 | $799,443 | $439,695 | $359,748 |
| 2017 | $10,984 | $783,769 | $431,074 | $352,695 |
| 2016 | $10,393 | $768,402 | $422,622 | $345,780 |
| 2015 | $10,318 | $756,861 | $416,274 | $340,587 |
| 2014 | $9,678 | $742,036 | $408,120 | $333,916 |
Source: Public Records
Map
Nearby Homes
- 1070 Bramblewood Ln
- 1287 Marcello Dr
- 1437 Marcello Dr
- 1788 Camino Leonor
- 981 Cassia Place
- 1087 Bigleaf Place Unit 105
- 1087 Bigleaf Place Unit 108
- 1068 Bigleaf Place Unit 402
- 314 Morning Star Dr Unit 38
- 324 Morning Star Dr Unit 43
- 1057 Foxglove Place Unit 202
- 0 Lundy Ave
- 2151 Oakland Rd Unit 523
- 2151 Oakland Rd Unit 308
- 2151 Oakland Rd Unit 231
- 2151 Oakland Rd Unit 14
- 2151 Oakland Rd Unit 443
- 2151 Oakland Rd Unit 210
- 2151 Oakland Rd Unit 297
- 2151 Oakland Rd Unit 189
- 1884 Fumia Place
- 1890 Fumia Place
- 1866 Fumia Place
- 1877 Fumia Place
- 1883 Fumia Place
- 1860 Fumia Place
- 1896 Fumia Place
- 1871 Fumia Place
- 1889 Fumia Place
- 1865 Fumia Place
- 1854 Fumia Place
- 1902 Fumia Place
- 1895 Fumia Place
- 1725 Feasel Ct
- 1859 Fumia Place
- 1848 Fumia Place
- 1724 Feasel Ct
- 1901 Fumia Place
- 1908 Fumia Place
- 1757 Fumia Dr