1878 Kenny Rd Columbus, OH 43212
Tri-Village NeighborhoodEstimated payment $1,048/month
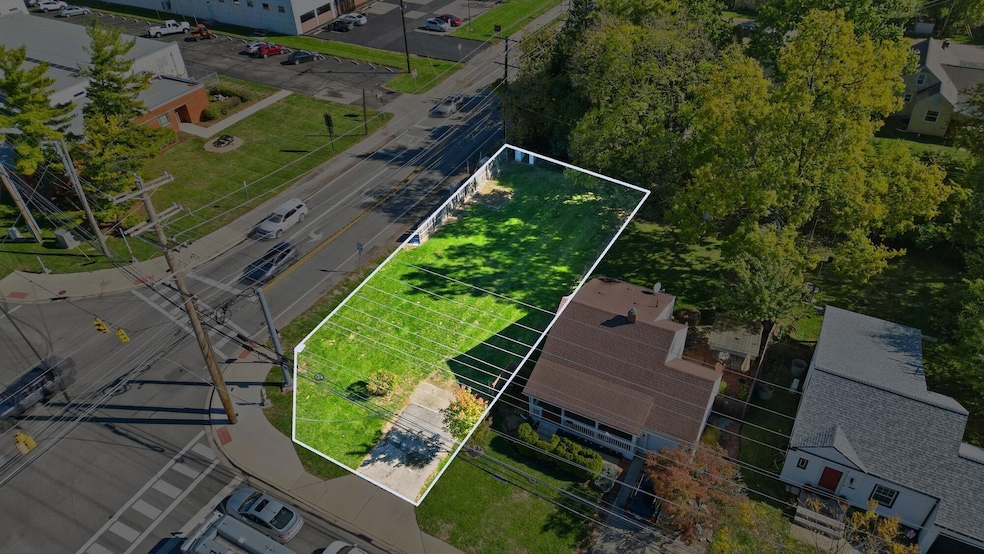
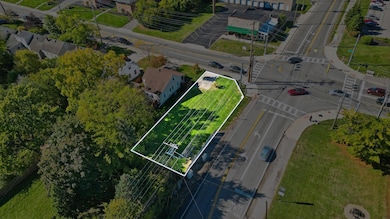
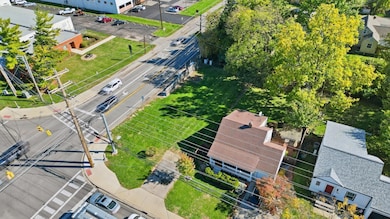
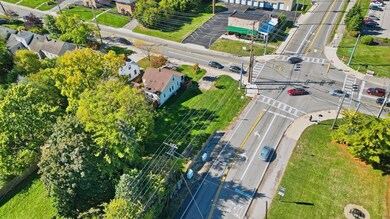
About This Lot
Prime investment opportunity in the highly desirable University View neighborhood to build a new house! Zoned R8 with potential conditional approval for two townhouse apartments.
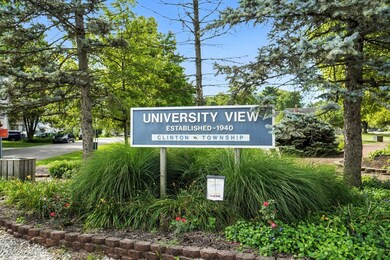
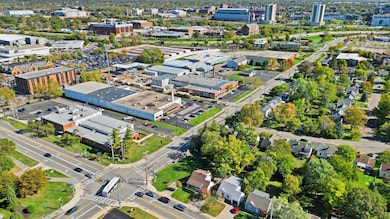
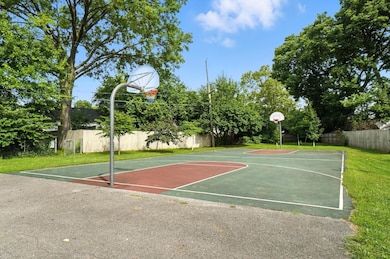
The location provides unbeatable proximity to OSU, UA, Grandview and the upcoming Carmenton District- a hub for innovation, healthcare and research that is poised to further demand in the area. For a possible rental property, the proximity to OSU ensures year-round rental strength, with demand driven professionals, graduate students, and medical staff. Community offers a park, inc a playground, tennis courts, baseketball court, and shelter house. This idyllic Post War community was built through a joint venture between HUD and the OSU School of Architecture to house veterans and their families as they attended OSU through the GI bills.
Property Details
Property Type
- Land
Est. Annual Taxes
- $2,138
Lot Details
- 6,970 Sq Ft Lot
Listing and Financial Details
- Assessor Parcel Number 130-001681
Map
Home Values in the Area
Average Home Value in this Area
Tax History
| Year | Tax Paid | Tax Assessment Tax Assessment Total Assessment is a certain percentage of the fair market value that is determined by local assessors to be the total taxable value of land and additions on the property. | Land | Improvement |
|---|---|---|---|---|
| 2024 | $2,138 | $36,300 | $36,300 | -- |
| 2023 | $2,115 | $36,295 | $36,295 | $0 |
| 2022 | $2,428 | $32,620 | $32,620 | $0 |
| 2021 | $2,431 | $32,620 | $32,620 | $0 |
| 2020 | $2,457 | $32,620 | $32,620 | $0 |
| 2019 | $4,967 | $61,460 | $32,620 | $28,840 |
| 2018 | $4,422 | $61,460 | $32,620 | $28,840 |
| 2017 | $4,697 | $61,460 | $32,620 | $28,840 |
| 2016 | $4,433 | $49,600 | $21,070 | $28,530 |
| 2015 | $3,882 | $49,600 | $21,070 | $28,530 |
| 2014 | $3,888 | $49,600 | $21,070 | $28,530 |
| 2013 | $1,817 | $47,215 | $20,055 | $27,160 |
Property History
| Date | Event | Price | List to Sale | Price per Sq Ft |
|---|---|---|---|---|
| 10/27/2025 10/27/25 | For Sale | $165,000 | -- | -- |
Purchase History
| Date | Type | Sale Price | Title Company |
|---|---|---|---|
| Corporate Deed | -- | Principle T | |
| Survivorship Deed | $95,000 | Chicago Title | |
| Warranty Deed | $85,000 | Esquire Title | |
| Deed | -- | -- | |
| Deed | $36,000 | -- |
Mortgage History
| Date | Status | Loan Amount | Loan Type |
|---|---|---|---|
| Previous Owner | $72,250 | Purchase Money Mortgage |
Source: Columbus and Central Ohio Regional MLS
MLS Number: 225040729
APN: 130-001681
Disclaimer: Certain information contained herein is derived from information provided by parties other than Homes.com. All information provided is deemed reliable, but is not guaranteed to be accurate and should be independently verified.
![]() IDX information is provided exclusively for personal, non-commercial use, and may not be used for any purpose other than to identify prospective properties consumers may be interested in purchasing.
IDX information is provided exclusively for personal, non-commercial use, and may not be used for any purpose other than to identify prospective properties consumers may be interested in purchasing.
Information is deemed reliable but not guaranteed.
- 1060 Sells Ave Unit 104
- 945 Chambers Rd
- 1126 King Ave Unit 128
- 1395 Upper Green Cir Unit 1395
- 1398 Lower Green Cir Unit 1398
- 00 W 7th Ave
- 1364 W 7th Ave
- 1825 Northwest Ct Unit D
- 1488 Essex Rd
- 1481 Doone Rd
- 1470 Cardiff Rd
- 1297 Doten Ave
- 1095 W 3rd Ave
- 1093 W 3rd Ave
- 1242 Oxley Rd
- 1083 W 3rd Ave
- 1240 Oxley Rd
- 1535 Doone Rd
- 1661 Ashland Ave Unit 663
- 1655-1657 Ashland Ave
- 1858 Kenny Rd
- 1813 Kenny Rd Unit 1809
- 1809-1813 Kenny Rd
- 858 Kinnear Rd
- 878 W 10th Ave
- 1751 Kenny Rd
- 887 W 10th Ave
- 1150 Kinnear Rd
- 1134 Chambers Rd
- 1648 Kenny Rd
- 1234 Steelwood Rd
- 1190 Chambers Rd
- 1211 Chambers Rd
- 1656-1662 Northwest Blvd
- 1550 Kenny Rd
- 1361 Presidential Dr
- 1295 Chesapeake Ave
- 900 Nettle Dr
- 1303-1307 King Ave
- 1350 King Ave Unit 105
