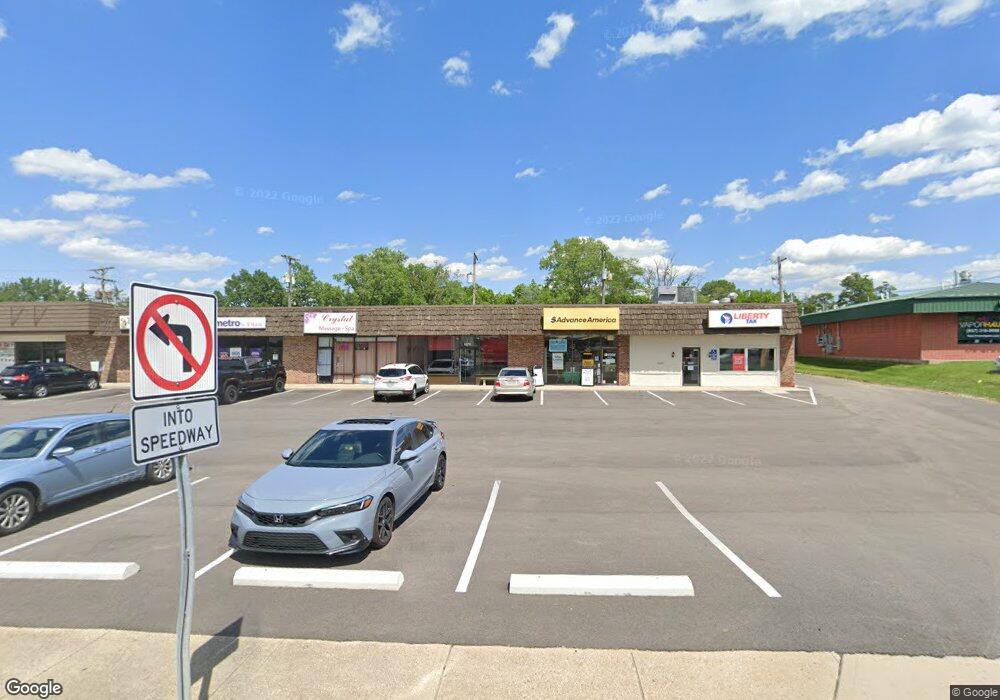
1878 S Maple Ave Fairborn, OH 45324
--
Bed
--
Bath
8,450
Sq Ft
1.28
Acres
About This Home
This home is located at 1878 S Maple Ave, Fairborn, OH 45324. 1878 S Maple Ave is a home located in Greene County with nearby schools including Fairborn Primary School, Fairborn Intermediate School, and Fairborn Middle School.
Ownership History
Date
Name
Owned For
Owner Type
Purchase Details
Closed on
Jan 30, 2025
Sold by
Fairborn Center Llc
Bought by
Atl Realty Group Llc
Home Financials for this Owner
Home Financials are based on the most recent Mortgage that was taken out on this home.
Original Mortgage
$400,000
Outstanding Balance
$397,595
Interest Rate
6.85%
Mortgage Type
Seller Take Back
Purchase Details
Closed on
Apr 11, 2023
Sold by
Rlf Property Holdings Llc
Bought by
Fairborn Center Llc
Home Financials for this Owner
Home Financials are based on the most recent Mortgage that was taken out on this home.
Original Mortgage
$343,000
Interest Rate
6.65%
Mortgage Type
New Conventional
Purchase Details
Closed on
Aug 12, 2015
Sold by
Frydman Renate
Bought by
Frydman Renate L and Amended Revocable Living Trust
Purchase Details
Closed on
May 28, 2015
Sold by
Frydman Renate and Frydman Joel
Bought by
Frydman Renate and Bwa Trust
Purchase Details
Closed on
Jul 10, 2013
Sold by
Appel Carmen and Frydman Renate
Bought by
Appel Carmen and Carmen Appel Revocable Living Trust
Create a Home Valuation Report for This Property
The Home Valuation Report is an in-depth analysis detailing your home's value as well as a comparison with similar homes in the area
Home Values in the Area
Average Home Value in this Area
Purchase History
| Date | Buyer | Sale Price | Title Company |
|---|---|---|---|
| Atl Realty Group Llc | -- | None Listed On Document | |
| Fairborn Center Llc | $190,000 | None Listed On Document | |
| Frydman Renate L | -- | Attorney | |
| Frydman Renate | -- | None Available | |
| Appel Carmen | -- | None Available |
Source: Public Records
Mortgage History
| Date | Status | Borrower | Loan Amount |
|---|---|---|---|
| Open | Atl Realty Group Llc | $400,000 | |
| Previous Owner | Fairborn Center Llc | $343,000 |
Source: Public Records
Tax History Compared to Growth
Tax History
| Year | Tax Paid | Tax Assessment Tax Assessment Total Assessment is a certain percentage of the fair market value that is determined by local assessors to be the total taxable value of land and additions on the property. | Land | Improvement |
|---|---|---|---|---|
| 2024 | $7,707 | $133,900 | $58,500 | $75,400 |
| 2023 | $7,707 | $133,900 | $58,500 | $75,400 |
| 2022 | $8,563 | $128,230 | $58,500 | $69,730 |
| 2021 | $8,712 | $128,230 | $58,500 | $69,730 |
| 2020 | $8,731 | $128,230 | $58,500 | $69,730 |
| 2019 | $8,102 | $122,620 | $58,500 | $64,120 |
| 2018 | $8,184 | $122,610 | $58,500 | $64,110 |
| 2017 | $8,022 | $122,610 | $58,500 | $64,110 |
| 2016 | $7,930 | $120,470 | $58,500 | $61,970 |
| 2015 | $7,621 | $120,470 | $58,500 | $61,970 |
| 2014 | $7,445 | $120,470 | $58,500 | $61,970 |
Source: Public Records
Map
Nearby Homes
- 1943 Fraternity Ct
- 1558 Glendale Dr
- 1508 S Maple Ave
- 1514 Burchwood Dr
- 366 Cherrywood Dr
- 362 Ridgewood Dr
- 346 Fairway Dr
- 2148 Beaver Valley Rd
- 2133 Chapel Dr
- 353 Bellaire Dr
- 482 Oak Lawn Dr
- 1373 Maplegrove Dr
- 156 Mark Ln
- 523 Greene Tree Place
- 1469 Ironwood Dr
- 225 Forest St
- Lot 4 W Dayton-Yellow Springs Rd
- Lot 3 W Dayton-Yellow Springs Rd
- 313 Grove St
- 2221 Tall Timber Ct
- 1854 S Maple Ave
- 1854 S Maple Ave Unit 3-4
- 128 E Funderburg Rd
- 114 E Funderburg Rd
- 108 E Funderburg Rd
- 50 E Funderburg Rd
- 129 Forestdale Ave
- 129 Forestdale Ave Unit 133
- 1845 Langview Dr
- 121 Forestdale Ave
- 44 E Funderburg Rd
- 113 Forestdale Ave
- 211 E Dayton Yellow Springs Rd
- 133 Forestdale Ave
- 32 E Funderburg Rd
- 1855 Langview Dr
- 49 Forestdale Ave
- 1835 Langview Dr
- 275 5 Points Ln
- 1818 S Maple Ave