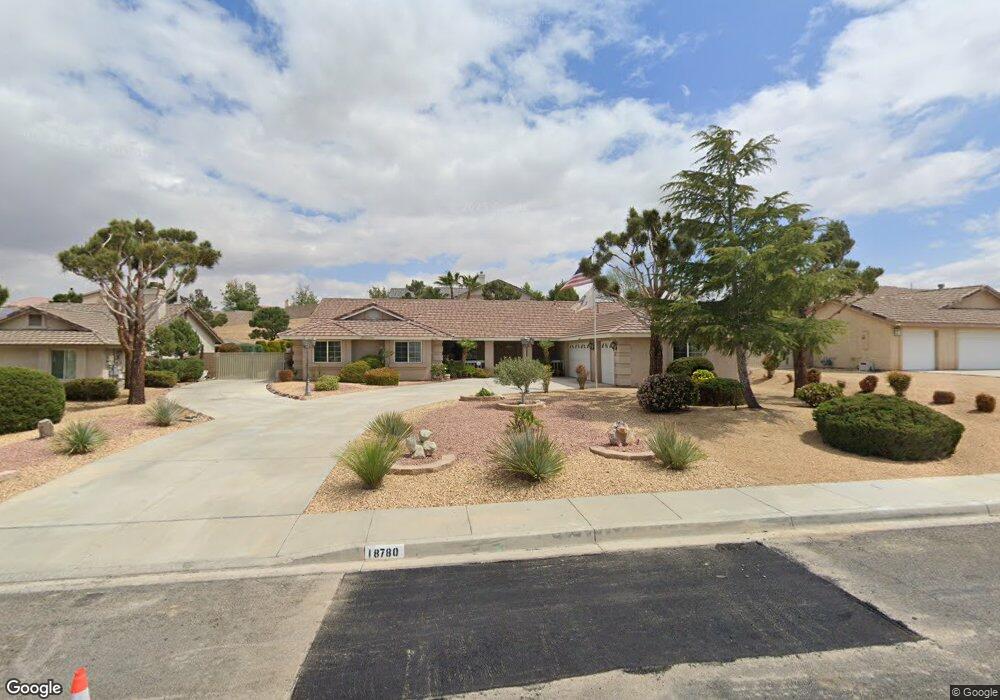
18780 Sahale Ln Apple Valley, CA 92307
High Desert NeighborhoodEstimated Value: $560,110 - $616,000
4
Beds
3
Baths
2,598
Sq Ft
$226/Sq Ft
Est. Value
About This Home
This home is located at 18780 Sahale Ln, Apple Valley, CA 92307 and is currently estimated at $588,278, approximately $226 per square foot. 18780 Sahale Ln is a home located in San Bernardino County with nearby schools including Rio Vista School of Applied Learning, Apple Valley High School, and Academy for Academic Excellence.
Ownership History
Date
Name
Owned For
Owner Type
Purchase Details
Closed on
Feb 24, 2006
Sold by
Reed Leon
Bought by
Reed Leon and Reed Mary M
Current Estimated Value
Home Financials for this Owner
Home Financials are based on the most recent Mortgage that was taken out on this home.
Original Mortgage
$544,185
Outstanding Balance
$308,096
Interest Rate
6.2%
Mortgage Type
Reverse Mortgage Home Equity Conversion Mortgage
Estimated Equity
$280,182
Purchase Details
Closed on
Jul 12, 2002
Sold by
West River Bend Lp
Bought by
Reed Leon and Reed Mary Reed
Home Financials for this Owner
Home Financials are based on the most recent Mortgage that was taken out on this home.
Original Mortgage
$90,000
Interest Rate
6.7%
Purchase Details
Closed on
Mar 23, 2002
Sold by
High Country Development Company 2
Bought by
West River Bend Lp
Create a Home Valuation Report for This Property
The Home Valuation Report is an in-depth analysis detailing your home's value as well as a comparison with similar homes in the area
Home Values in the Area
Average Home Value in this Area
Purchase History
| Date | Buyer | Sale Price | Title Company |
|---|---|---|---|
| Reed Leon | -- | Fidelity | |
| Reed Leon | $218,000 | First American Title Ins Co | |
| West River Bend Lp | $577,000 | First American Title Ins Co |
Source: Public Records
Mortgage History
| Date | Status | Borrower | Loan Amount |
|---|---|---|---|
| Open | Reed Leon | $544,185 | |
| Closed | Reed Leon | $90,000 |
Source: Public Records
Tax History
| Year | Tax Paid | Tax Assessment Tax Assessment Total Assessment is a certain percentage of the fair market value that is determined by local assessors to be the total taxable value of land and additions on the property. | Land | Improvement |
|---|---|---|---|---|
| 2025 | $3,794 | $331,672 | $57,934 | $273,738 |
| 2024 | $3,685 | $325,169 | $56,798 | $268,371 |
| 2023 | $3,650 | $318,793 | $55,684 | $263,109 |
| 2022 | $3,594 | $312,542 | $54,592 | $257,950 |
| 2021 | $3,510 | $306,414 | $53,522 | $252,892 |
| 2020 | $3,467 | $303,272 | $52,973 | $250,299 |
| 2019 | $3,402 | $297,325 | $51,934 | $245,391 |
| 2018 | $3,317 | $291,495 | $50,916 | $240,579 |
| 2017 | $3,270 | $285,780 | $49,918 | $235,862 |
| 2016 | $3,155 | $280,176 | $48,939 | $231,237 |
| 2015 | $3,107 | $275,968 | $48,204 | $227,764 |
| 2014 | $3,065 | $270,562 | $47,260 | $223,302 |
Source: Public Records
Map
Nearby Homes
- 18891 Shoshonee Rd
- 18475 Trout
- 13535 Driftwood Dr
- 13501 Driftwood Dr
- 13665 Driftwood Dr
- 13436 Havasu Rd
- 13608 Sea Gull Dr
- 13395 Driftwood Dr
- 18570 Niagara Dr
- 13380 Driftwood Dr
- 13771 Wawona Rd
- 18310 Niagara Dr
- 19185 Cochise Place
- 13250 Ivanpah Rd
- 13262 Cuyamaca Rd
- 14171 Tehachapi Rd
- 0 Riverside Dell
- 13185 Meteor Dr
- 13980 Driftwood Dr
- 18055 Lakeview Dr
- 18794 Sahale Ln
- 18770 Sahale Ln
- 13801 Sahale Place
- 18810 Sahale Ln
- 18775 Sahale Ln
- 13809 Sahale*view View View* Place
- 13768 Sahale Ct
- 13809 Sahale Place
- 18826 Sahale Ln
- 18795 Sahale Ln
- 13808 Sahale Place
- 13782 Sahale Ct
- 18759 Sahale Ln
- 18742 Sahale Ln
- 13806 Sahale Place
- 0 Sahale Unit 315004267
- 0 Sahale Unit 335913
- 0 Sahale Unit P0-315004267
- 13796 Sahale Ct
- 18733 Sahale Ln
Your Personal Tour Guide
Ask me questions while you tour the home.