18781 Deer Trail Rd Banning, CA 92220
Estimated Value: $304,298 - $369,000
3
Beds
2
Baths
1,120
Sq Ft
$307/Sq Ft
Est. Value
About This Home
This home is located at 18781 Deer Trail Rd, Banning, CA 92220 and is currently estimated at $343,325, approximately $306 per square foot. 18781 Deer Trail Rd is a home located in Riverside County with nearby schools including Banning High School.
Ownership History
Date
Name
Owned For
Owner Type
Purchase Details
Closed on
Jul 30, 2003
Sold by
Keating Robert
Bought by
Lopez Margaret G
Current Estimated Value
Home Financials for this Owner
Home Financials are based on the most recent Mortgage that was taken out on this home.
Original Mortgage
$53,500
Outstanding Balance
$23,285
Interest Rate
5.46%
Mortgage Type
Purchase Money Mortgage
Estimated Equity
$320,040
Purchase Details
Closed on
Jun 17, 2003
Sold by
Keating Connie
Bought by
Keating Robert
Home Financials for this Owner
Home Financials are based on the most recent Mortgage that was taken out on this home.
Original Mortgage
$53,500
Outstanding Balance
$23,285
Interest Rate
5.46%
Mortgage Type
Purchase Money Mortgage
Estimated Equity
$320,040
Purchase Details
Closed on
Mar 26, 2003
Sold by
Cormell Shaffer and Cormell Melissa
Bought by
Keating Robert and Keating Connie
Purchase Details
Closed on
Dec 12, 2001
Sold by
Svetinsky Marie
Bought by
Cormell Shaffer and Cormell Melissa
Create a Home Valuation Report for This Property
The Home Valuation Report is an in-depth analysis detailing your home's value as well as a comparison with similar homes in the area
Home Values in the Area
Average Home Value in this Area
Purchase History
| Date | Buyer | Sale Price | Title Company |
|---|---|---|---|
| Lopez Margaret G | $98,500 | Orange Coast Title Co | |
| Keating Robert | -- | -- | |
| Keating Robert | -- | -- | |
| Keating Robert | -- | -- | |
| Keating Robert | $5,000 | -- | |
| Keating Robert | $5,000 | -- | |
| Keating Robert | $5,000 | -- | |
| Cormell Shaffer | $8,500 | -- | |
| Cormell Shaffer | $8,500 | -- | |
| Cormell Shaffer | $8,500 | -- |
Source: Public Records
Mortgage History
| Date | Status | Borrower | Loan Amount |
|---|---|---|---|
| Open | Lopez Margaret G | $53,500 |
Source: Public Records
Tax History Compared to Growth
Tax History
| Year | Tax Paid | Tax Assessment Tax Assessment Total Assessment is a certain percentage of the fair market value that is determined by local assessors to be the total taxable value of land and additions on the property. | Land | Improvement |
|---|---|---|---|---|
| 2025 | $2,099 | $132,911 | $21,312 | $111,599 |
| 2023 | $2,099 | $127,752 | $20,486 | $107,266 |
| 2022 | $3,042 | $125,248 | $20,085 | $105,163 |
| 2021 | $2,988 | $122,793 | $19,692 | $103,101 |
| 2020 | $2,906 | $121,535 | $19,491 | $102,044 |
| 2019 | $2,858 | $119,153 | $19,109 | $100,044 |
| 2018 | $2,821 | $116,818 | $18,735 | $98,083 |
| 2017 | $2,836 | $114,528 | $18,368 | $96,160 |
| 2016 | $2,673 | $112,283 | $18,008 | $94,275 |
| 2015 | $2,606 | $101,000 | $16,000 | $85,000 |
| 2014 | $1,469 | $85,000 | $14,000 | $71,000 |
Source: Public Records
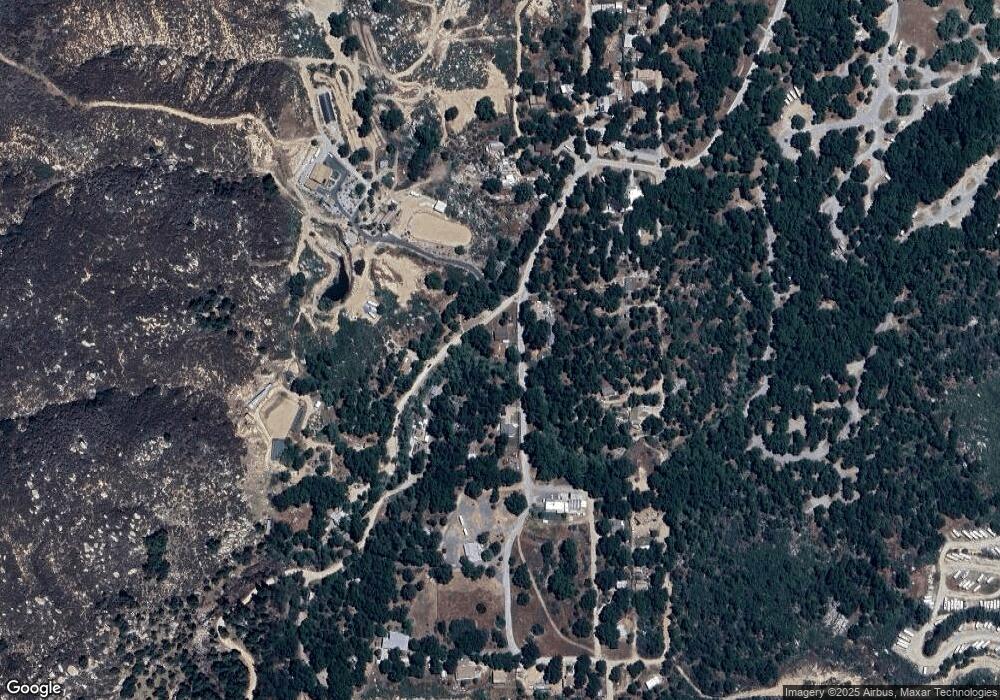
Map
Nearby Homes
- 1 Cryer Road Poppet Flats Rd
- 18565 Keyes Dr
- 18701 Keyes Dr
- 18670 Cryer Dr
- 0 Canyon Rd Unit IG25170993
- 0 Canyon Rd Unit IG25064828
- 45912 Raccoon Rd
- 18525 Keyes Dr
- 45902 Lynx St
- 45860 Coyote St
- 45905 Partridge St
- 0 Keyes Dr
- 0 Partridge Ln Unit 219136072DA
- 45700 Grouse St
- 19385 Houston Dr
- 22 Poppet Truck Trail
- 19030 Esperanza Firefighters Memorial Hwy
- 00 Mount Edna Rd
- 0 Mt Edna Rd Unit HD25117177
- 0 Mt Edna Rd Unit EV24190146
- 18773 Deer Trail Rd
- 18809 Deer Trail Rd
- 18765 Deer Trail Rd
- 18824 Deer Trail Rd
- 18778 Deer Trail Rd
- 1 Deer Trail
- 18840 Deer Trail Rd
- 18759 Cryer Dr
- 18839 Deer Trail Rd
- 18830 Ellis Dr
- 18803 Cryer Dr
- 18850 Woolvine Dr
- 18849 Deer Trail Rd
- 18717 Cryer Dr
- 18868 Deer Trail Rd
- 18759 Keyes Dr
- 18840 Cryer Dr
- 18740 Ellis Dr
- 18829 Keyes Dr
- 18741 Keyes Dr