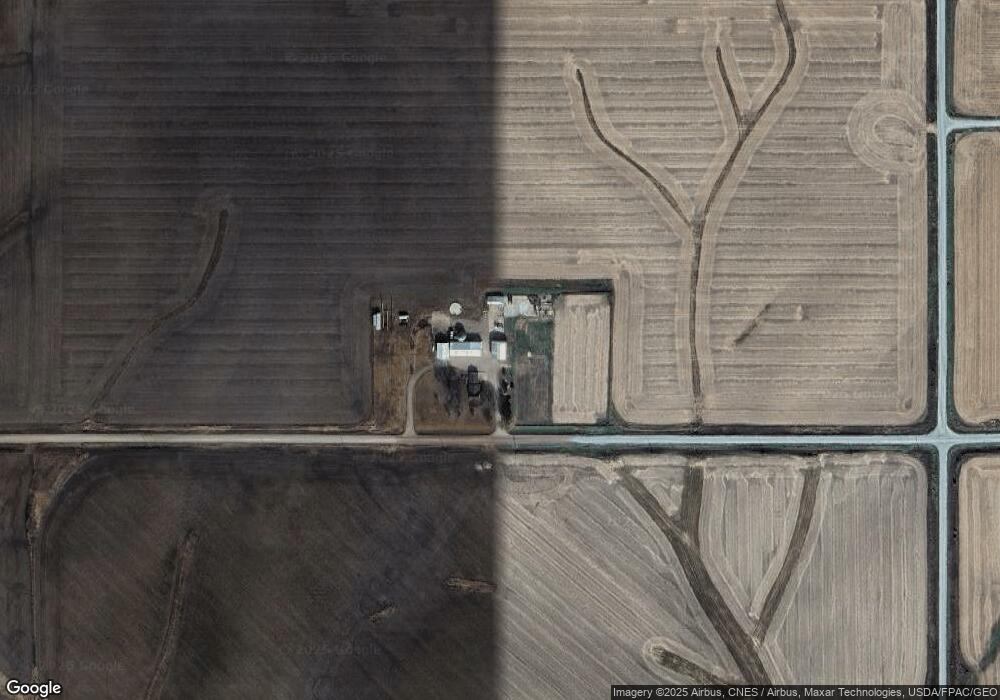
1879 500th Ave Montezuma, IA 50171
Estimated Value: $314,000 - $3,744,000
4
Beds
2
Baths
2,331
Sq Ft
$523/Sq Ft
Est. Value
About This Home
This home is located at 1879 500th Ave, Montezuma, IA 50171 and is currently estimated at $1,219,033, approximately $522 per square foot. 1879 500th Ave is a home located in Poweshiek County with nearby schools including Montezuma Elementary School and Montezuma Junior High School.
Ownership History
Date
Name
Owned For
Owner Type
Purchase Details
Closed on
Jun 27, 2012
Sold by
Mcwilliams Robert R and Mcwilliams Irena
Bought by
Roorda Brian L and Roorda Liesi K
Current Estimated Value
Home Financials for this Owner
Home Financials are based on the most recent Mortgage that was taken out on this home.
Original Mortgage
$1,456,000
Outstanding Balance
$617,584
Interest Rate
3.77%
Mortgage Type
Farmers Home Administration
Estimated Equity
$601,449
Create a Home Valuation Report for This Property
The Home Valuation Report is an in-depth analysis detailing your home's value as well as a comparison with similar homes in the area
Home Values in the Area
Average Home Value in this Area
Purchase History
| Date | Buyer | Sale Price | Title Company |
|---|---|---|---|
| Roorda Brian L | $2,120,000 | None Available |
Source: Public Records
Mortgage History
| Date | Status | Borrower | Loan Amount |
|---|---|---|---|
| Open | Roorda Brian L | $1,456,000 |
Source: Public Records
Tax History Compared to Growth
Tax History
| Year | Tax Paid | Tax Assessment Tax Assessment Total Assessment is a certain percentage of the fair market value that is determined by local assessors to be the total taxable value of land and additions on the property. | Land | Improvement |
|---|---|---|---|---|
| 2025 | $2,660 | $282,670 | $9,210 | $273,460 |
| 2024 | $2,764 | $249,010 | $7,240 | $241,770 |
| 2023 | $2,550 | $249,010 | $7,240 | $241,770 |
| 2022 | $2,562 | $194,560 | $6,220 | $188,340 |
| 2021 | $2,562 | $184,950 | $6,220 | $178,730 |
| 2020 | $2,262 | $162,420 | $5,920 | $156,500 |
| 2019 | $1,998 | $162,420 | $5,920 | $156,500 |
| 2018 | $1,972 | $149,170 | $8,480 | $140,690 |
| 2017 | $2,028 | $149,170 | $8,480 | $140,690 |
| 2016 | $2,002 | $160,140 | $9,830 | $150,310 |
| 2015 | -- | $160,140 | $9,830 | $150,310 |
| 2014 | -- | $149,110 | $10,180 | $138,930 |
Source: Public Records
Map
Nearby Homes