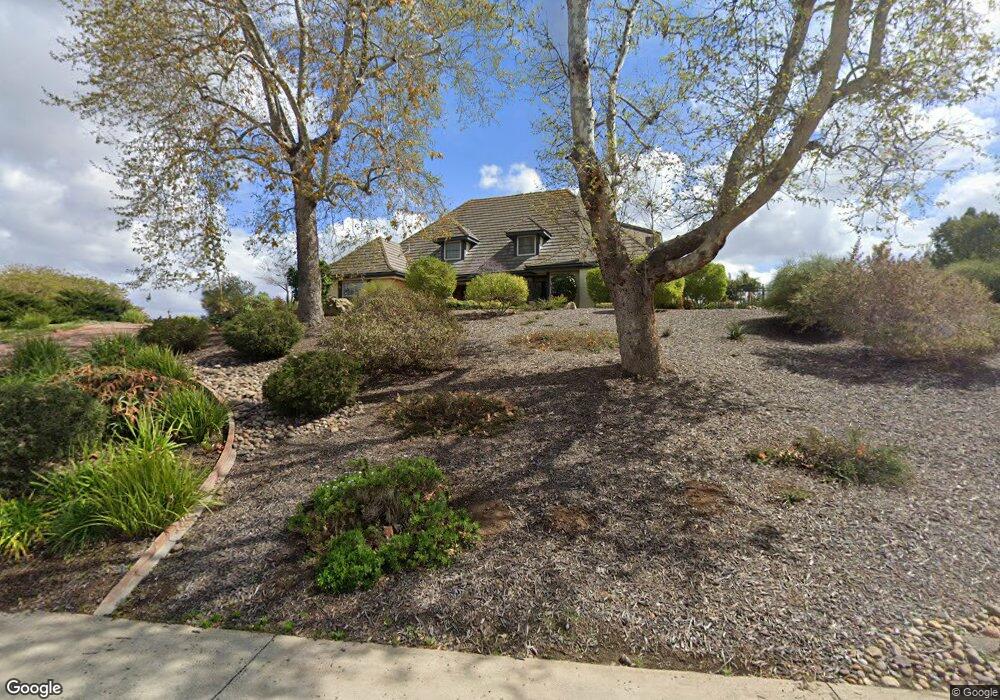
18797 Olmeda Place San Diego, CA 92128
Rancho Bernardo NeighborhoodEstimated Value: $2,522,825 - $2,840,000
4
Beds
5
Baths
4,753
Sq Ft
$551/Sq Ft
Est. Value
About This Home
This home is located at 18797 Olmeda Place, San Diego, CA 92128 and is currently estimated at $2,619,206, approximately $551 per square foot. 18797 Olmeda Place is a home located in San Diego County with nearby schools including Chaparral Elementary, Bernardo Heights Middle, and Rancho Bernardo High.
Ownership History
Date
Name
Owned For
Owner Type
Purchase Details
Closed on
Feb 15, 2019
Sold by
Walters Dean D and Walters Jennifer B
Bought by
Bosco Alexander and Bosco Amanda
Current Estimated Value
Home Financials for this Owner
Home Financials are based on the most recent Mortgage that was taken out on this home.
Original Mortgage
$1,115,000
Outstanding Balance
$978,286
Interest Rate
4.4%
Mortgage Type
New Conventional
Estimated Equity
$1,640,920
Purchase Details
Closed on
Aug 18, 2011
Sold by
Silva Patricia
Bought by
Watters Dean D and Watters Jennifer B
Home Financials for this Owner
Home Financials are based on the most recent Mortgage that was taken out on this home.
Original Mortgage
$650,000
Interest Rate
4.48%
Mortgage Type
New Conventional
Purchase Details
Closed on
Jul 20, 1998
Sold by
Silva Edward J and Silva Patricia
Bought by
Silva Edward J and Silva Patricia
Home Financials for this Owner
Home Financials are based on the most recent Mortgage that was taken out on this home.
Original Mortgage
$740,000
Interest Rate
6.9%
Purchase Details
Closed on
Aug 26, 1986
Create a Home Valuation Report for This Property
The Home Valuation Report is an in-depth analysis detailing your home's value as well as a comparison with similar homes in the area
Home Values in the Area
Average Home Value in this Area
Purchase History
| Date | Buyer | Sale Price | Title Company |
|---|---|---|---|
| Bosco Alexander | $1,515,000 | Lawyers Title Company | |
| Watters Dean D | $1,125,000 | Corinthian Title Co | |
| Silva Edward J | -- | -- | |
| Silva Edward J | -- | American Title Co | |
| -- | $751,000 | -- |
Source: Public Records
Mortgage History
| Date | Status | Borrower | Loan Amount |
|---|---|---|---|
| Open | Bosco Alexander | $1,115,000 | |
| Previous Owner | Watters Dean D | $650,000 | |
| Previous Owner | Silva Edward J | $740,000 |
Source: Public Records
Tax History Compared to Growth
Tax History
| Year | Tax Paid | Tax Assessment Tax Assessment Total Assessment is a certain percentage of the fair market value that is determined by local assessors to be the total taxable value of land and additions on the property. | Land | Improvement |
|---|---|---|---|---|
| 2025 | $18,626 | $1,690,007 | $892,413 | $797,594 |
| 2024 | $18,626 | $1,656,870 | $874,915 | $781,955 |
| 2023 | $18,230 | $1,624,383 | $857,760 | $766,623 |
| 2022 | $17,926 | $1,592,534 | $840,942 | $751,592 |
| 2021 | $17,690 | $1,561,308 | $824,453 | $736,855 |
| 2020 | $17,451 | $1,545,300 | $816,000 | $729,300 |
| 2019 | $14,599 | $1,301,747 | $534,840 | $766,907 |
| 2018 | $14,186 | $1,276,223 | $524,353 | $751,870 |
| 2017 | $83 | $1,251,200 | $514,072 | $737,128 |
| 2016 | $13,524 | $1,226,668 | $503,993 | $722,675 |
| 2015 | $12,962 | $1,175,739 | $496,423 | $679,316 |
| 2014 | $12,654 | $1,152,709 | $486,699 | $666,010 |
Source: Public Records
Map
Nearby Homes
- 12982 Polvera Ct
- 18818 Bernardo Trails Dr Unit 6
- 18787 Aceituno St
- 12916 Polvera Ave
- 12725 Via Nasca
- 18035 Avenida Alozdra Unit 298
- 17842 Avenida Cordillera Unit 30
- 12870 Camino de la Breccia
- 12732 Camino de la Breccia Unit 9
- 17909 Avenida Alozdra
- 18018 Calle Estepona
- 12865 Camino de la Breccia Unit 109
- 12977 Camino Emparrado
- 13356 Corte de Chucena
- 12564 Chetenham Ln
- 12880 Circulo Dardo
- 17762 Plaza Acosta
- 17738 Plaza Acosta
- 12512 Cloudesly Dr
- 17780 Cumana Terrace
- 18777 Olmeda Place
- 13013 Polvera Ave
- 13004 Polvera Ave
- 18747 Olmeda Place
- 18798 Olmeda Place
- 13014 Polvera Ave
- 18778 Olmeda Place
- 18758 Olmeda Place
- 12986 Polvera Ave
- 13023 Polvera Ave
- 18727 Olmeda Place
- 18748 Olmeda Place
- 13024 Polvera Ave
- 12983 Polvera Ave
- 12983 Polvera Ave
- 12972 Polvera Ave Unit 4
- 13023 Olmeda Ct
- 13024 Olmeda Ct
- 13033 Olmeda Ct
- 18738 Olmeda Place