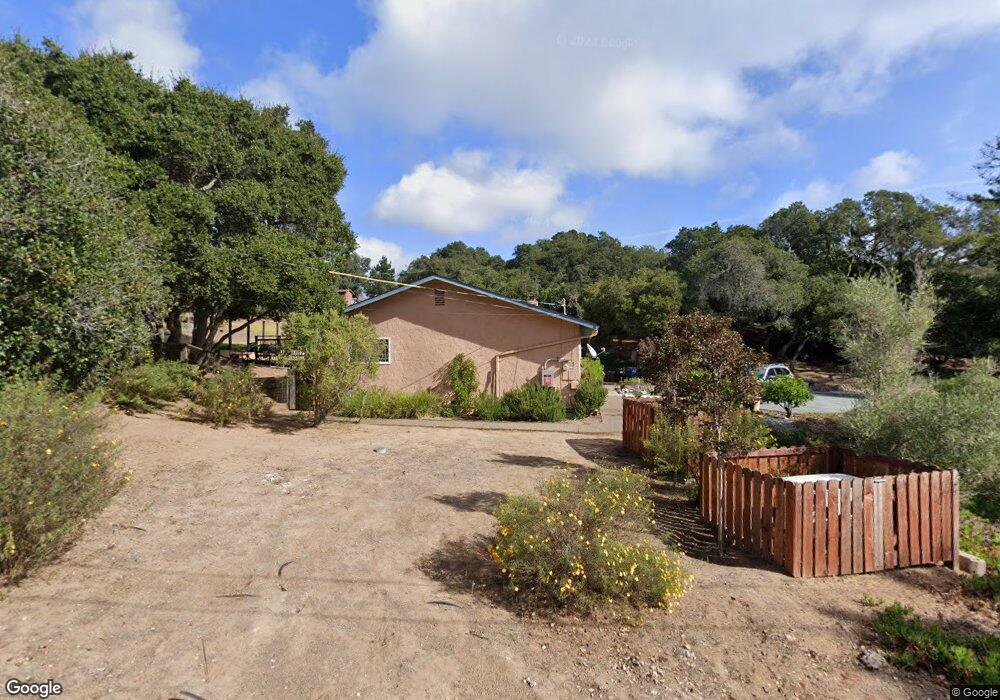
18799 Moro Rd Salinas, CA 93907
Estimated Value: $786,675 - $856,000
3
Beds
2
Baths
1,474
Sq Ft
$565/Sq Ft
Est. Value
About This Home
This home is located at 18799 Moro Rd, Salinas, CA 93907 and is currently estimated at $832,669, approximately $564 per square foot. 18799 Moro Rd is a home located in Monterey County with nearby schools including North Monterey County Middle School, North Monterey County High School, and Oasis Charter Public.
Ownership History
Date
Name
Owned For
Owner Type
Purchase Details
Closed on
Apr 27, 2011
Sold by
U S Bank National Association
Bought by
Longwell Bryan and Longwell Kathleen
Current Estimated Value
Home Financials for this Owner
Home Financials are based on the most recent Mortgage that was taken out on this home.
Original Mortgage
$266,000
Outstanding Balance
$183,575
Interest Rate
4.73%
Mortgage Type
New Conventional
Estimated Equity
$649,094
Purchase Details
Closed on
Jan 11, 2011
Sold by
Robinson Robert Floyd and Robinson Christina
Bought by
Bank Of America National Association
Purchase Details
Closed on
Nov 1, 2004
Sold by
Hall Cameron Bramble
Bought by
Robinson Robert Floyd and Robinson Christina
Home Financials for this Owner
Home Financials are based on the most recent Mortgage that was taken out on this home.
Original Mortgage
$440,000
Interest Rate
4.87%
Mortgage Type
Unknown
Purchase Details
Closed on
Oct 3, 1996
Sold by
Hall Cameron B
Bought by
Hall Cameron Bramble
Create a Home Valuation Report for This Property
The Home Valuation Report is an in-depth analysis detailing your home's value as well as a comparison with similar homes in the area
Home Values in the Area
Average Home Value in this Area
Purchase History
| Date | Buyer | Sale Price | Title Company |
|---|---|---|---|
| Longwell Bryan | $280,000 | First American Title | |
| Bank Of America National Association | $303,170 | None Available | |
| Robinson Robert Floyd | $550,000 | Stewart Title | |
| Hall Cameron Bramble | -- | -- |
Source: Public Records
Mortgage History
| Date | Status | Borrower | Loan Amount |
|---|---|---|---|
| Open | Longwell Bryan | $266,000 | |
| Previous Owner | Robinson Robert Floyd | $440,000 | |
| Closed | Robinson Robert Floyd | $82,500 |
Source: Public Records
Tax History Compared to Growth
Tax History
| Year | Tax Paid | Tax Assessment Tax Assessment Total Assessment is a certain percentage of the fair market value that is determined by local assessors to be the total taxable value of land and additions on the property. | Land | Improvement |
|---|---|---|---|---|
| 2025 | $3,879 | $358,717 | $192,170 | $166,547 |
| 2024 | $3,879 | $351,684 | $188,402 | $163,282 |
| 2023 | $3,810 | $344,789 | $184,708 | $160,081 |
| 2022 | $3,774 | $338,030 | $181,087 | $156,943 |
| 2021 | $3,631 | $331,403 | $177,537 | $153,866 |
| 2020 | $3,586 | $328,006 | $175,717 | $152,289 |
| 2019 | $3,502 | $321,575 | $172,272 | $149,303 |
| 2018 | $3,440 | $315,271 | $168,895 | $146,376 |
| 2017 | $3,250 | $309,090 | $165,584 | $143,506 |
| 2016 | $3,382 | $303,031 | $162,338 | $140,693 |
| 2015 | $3,250 | $298,480 | $159,900 | $138,580 |
| 2014 | $3,193 | $292,634 | $156,768 | $135,866 |
Source: Public Records
Map
Nearby Homes
- 18751 Moro Rd
- 18810 Moro Rd
- 11 Montclair Place
- 7183 Tustin Rd
- 7125 Tustin Rd
- 19018 Beatrice Dr
- 6477 Boyer Dr
- 6595 Frankie Ln
- 19060 Oak Heights Dr
- 6640 Kim Ann Ln
- 7571 Via Guiseppe Ln
- 7500 Langley Canyon Rd
- 524 Echo Valley Rd
- 6967 Valle Pacifico Rd
- 7561 Chester Dr
- 7190 Azzelio Way
- 2646 El Camino Real N
- 19225 Reavis Way
- 17617 Pond Derosa Ln Unit 29
- 18221 Berta Canyon Rd
- 18755 Moro Rd
- 18759 Moro Rd
- 18757 Moro Rd
- 18835 Moro Rd
- 18745 Moro Rd
- 18837 Moro Rd
- 18807 Moro Rd
- 18725 Linda Vista Place
- 18735 Linda Vista Place
- 18745 Linda Vista Place
- 18755 Linda Vista Place
- 18715 Linda Vista Place
- 18851 Moro Cir
- 18740 Linda Vista Place
- 18839 Moro Rd
- 18832 Moro Rd
- 18841 Moro Rd
- 8 Montclair Place
- 18750 Linda Vista Place Unit P1
- 18750 Linda Vista Place