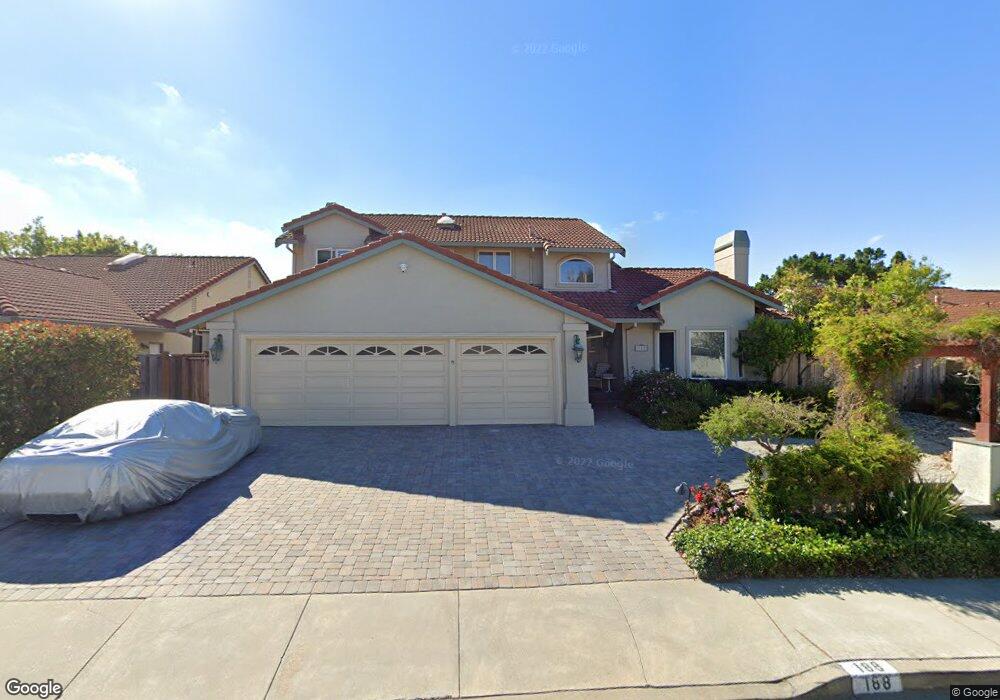
188 Mesa Verde Way San Carlos, CA 94070
Alder Manor NeighborhoodEstimated Value: $3,245,231 - $3,919,000
4
Beds
3
Baths
2,790
Sq Ft
$1,271/Sq Ft
Est. Value
About This Home
This home is located at 188 Mesa Verde Way, San Carlos, CA 94070 and is currently estimated at $3,546,308, approximately $1,271 per square foot. 188 Mesa Verde Way is a home located in San Mateo County with nearby schools including Tierra Linda Middle School, Carlmont High School, and Heather Elementary School.
Ownership History
Date
Name
Owned For
Owner Type
Purchase Details
Closed on
Sep 19, 2024
Sold by
Ansari Mehran
Bought by
Ansari Roya
Current Estimated Value
Purchase Details
Closed on
Jun 5, 2002
Sold by
Danly David R and Kelley Mary M
Bought by
Ansari Mehran and Ansari Roya
Home Financials for this Owner
Home Financials are based on the most recent Mortgage that was taken out on this home.
Original Mortgage
$1,000,000
Interest Rate
6.25%
Purchase Details
Closed on
Sep 18, 1996
Sold by
Cales Richard H and Cales Carolyn D
Bought by
Danly David R and Kelley Mary M
Home Financials for this Owner
Home Financials are based on the most recent Mortgage that was taken out on this home.
Original Mortgage
$528,000
Interest Rate
8.14%
Create a Home Valuation Report for This Property
The Home Valuation Report is an in-depth analysis detailing your home's value as well as a comparison with similar homes in the area
Home Values in the Area
Average Home Value in this Area
Purchase History
| Date | Buyer | Sale Price | Title Company |
|---|---|---|---|
| Ansari Roya | -- | None Listed On Document | |
| Ansari Mehran | $1,420,000 | Commonwealth Land Title Ins | |
| Danly David R | $660,000 | Old Republic Title Company |
Source: Public Records
Mortgage History
| Date | Status | Borrower | Loan Amount |
|---|---|---|---|
| Previous Owner | Ansari Mehran | $1,000,000 | |
| Previous Owner | Danly David R | $528,000 |
Source: Public Records
Tax History Compared to Growth
Tax History
| Year | Tax Paid | Tax Assessment Tax Assessment Total Assessment is a certain percentage of the fair market value that is determined by local assessors to be the total taxable value of land and additions on the property. | Land | Improvement |
|---|---|---|---|---|
| 2025 | $24,988 | $2,097,754 | $1,048,877 | $1,048,877 |
| 2023 | $24,988 | $2,016,298 | $1,008,149 | $1,008,149 |
| 2022 | $23,462 | $1,976,764 | $988,382 | $988,382 |
| 2021 | $23,159 | $1,938,004 | $969,002 | $969,002 |
| 2020 | $22,934 | $1,918,134 | $959,067 | $959,067 |
| 2019 | $22,621 | $1,880,524 | $940,262 | $940,262 |
| 2018 | $22,038 | $1,843,652 | $921,826 | $921,826 |
| 2017 | $21,780 | $1,807,502 | $903,751 | $903,751 |
| 2016 | $21,353 | $1,772,062 | $886,031 | $886,031 |
| 2015 | $21,275 | $1,745,444 | $872,722 | $872,722 |
| 2014 | $20,753 | $1,711,254 | $855,627 | $855,627 |
Source: Public Records
Map
Nearby Homes
- 3161 La Mesa Dr
- 115 Crestview Ct
- 3271 Brittan Ave
- 3295 La Mesa Dr Unit 7
- 5 El Vanada Rd
- 3372 La Mesa Dr Unit 2
- 3350 La Mesa Dr Unit 9
- 2 El Vanada Rd
- 4 El Vanada Rd
- 3334 Brittan Ave Unit 9
- 416 Palomar Dr
- 758 Loma
- 760 Loma Ct
- 3374 Brittan Ave Unit 13
- 865 Somerset Ct
- 00 S Palomar Dr
- 2936 Eaton Ave
- 438 Portofino Dr Unit 101
- 0 S Palomar Dr
- 101 Coventry Ct
- 184 Mesa Verde Way
- 192 Mesa Verde Way
- 3190 La Mesa Dr
- 3194 La Mesa Dr
- 3186 La Mesa Dr
- 180 Mesa Verde Way
- 196 Mesa Verde Way
- 3198 La Mesa Dr
- 3182 La Mesa Dr
- 175 Mesa Verde Way
- 183 Mesa Verde Way
- 167 Mesa Verde Way
- 3178 La Mesa Dr
- 191 Mesa Verde Way
- 176 Mesa Verde Way
- 3185 La Mesa Dr
- 3189 La Mesa Dr
- 159 Mesa Verde Way
- 3193 La Mesa Dr
- 3174 La Mesa Dr