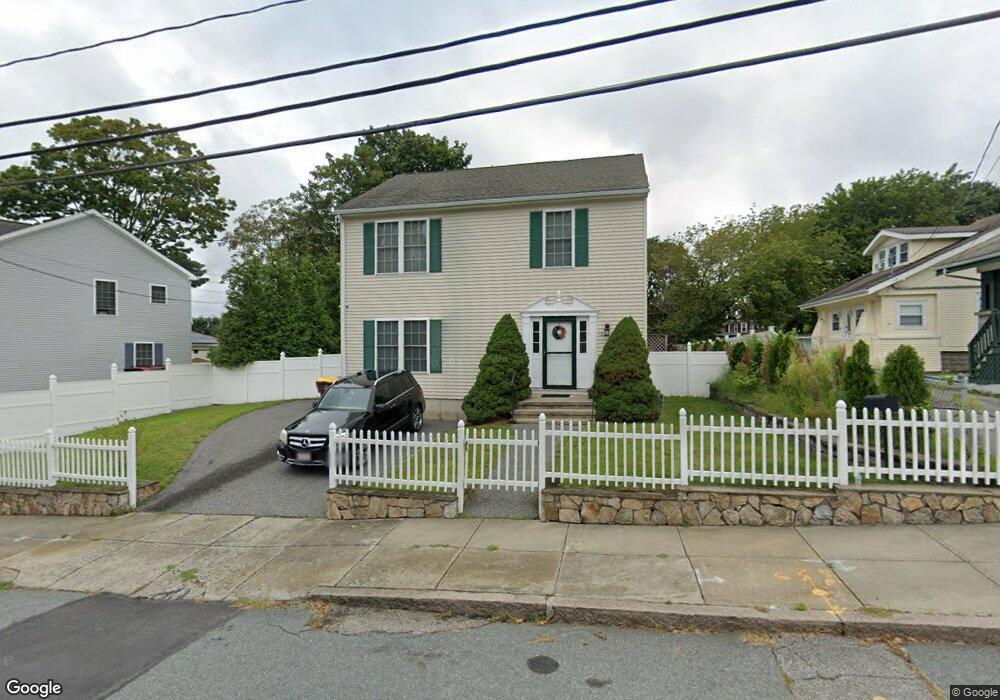
188 Slade St Fall River, MA 02724
Sandy Beach NeighborhoodEstimated Value: $435,000 - $493,594
3
Beds
3
Baths
2,640
Sq Ft
$177/Sq Ft
Est. Value
About This Home
This home is located at 188 Slade St, Fall River, MA 02724 and is currently estimated at $466,649, approximately $176 per square foot. 188 Slade St is a home located in Bristol County with nearby schools including Carlton M. Viveiros Elementary School, Matthew J. Kuss Middle School, and B M C Durfee High School.
Ownership History
Date
Name
Owned For
Owner Type
Purchase Details
Closed on
Oct 18, 2004
Sold by
Robillard Bldg Corp
Bought by
Morgan Andrea K
Current Estimated Value
Home Financials for this Owner
Home Financials are based on the most recent Mortgage that was taken out on this home.
Original Mortgage
$261,200
Outstanding Balance
$129,619
Interest Rate
5.8%
Mortgage Type
Purchase Money Mortgage
Estimated Equity
$337,030
Create a Home Valuation Report for This Property
The Home Valuation Report is an in-depth analysis detailing your home's value as well as a comparison with similar homes in the area
Home Values in the Area
Average Home Value in this Area
Purchase History
| Date | Buyer | Sale Price | Title Company |
|---|---|---|---|
| Morgan Andrea K | $275,000 | -- |
Source: Public Records
Mortgage History
| Date | Status | Borrower | Loan Amount |
|---|---|---|---|
| Open | Morgan Andrea K | $261,200 |
Source: Public Records
Tax History
| Year | Tax Paid | Tax Assessment Tax Assessment Total Assessment is a certain percentage of the fair market value that is determined by local assessors to be the total taxable value of land and additions on the property. | Land | Improvement |
|---|---|---|---|---|
| 2025 | $4,254 | $371,500 | $109,100 | $262,400 |
| 2024 | $3,986 | $346,900 | $105,100 | $241,800 |
| 2023 | $4,070 | $331,700 | $86,800 | $244,900 |
| 2022 | $3,650 | $289,200 | $82,700 | $206,500 |
| 2021 | $3,529 | $255,200 | $78,700 | $176,500 |
| 2020 | $3,510 | $242,900 | $77,500 | $165,400 |
| 2019 | $3,404 | $233,500 | $74,600 | $158,900 |
| 2018 | $3,382 | $231,300 | $80,800 | $150,500 |
| 2017 | $3,150 | $225,000 | $77,000 | $148,000 |
| 2016 | $3,026 | $222,000 | $82,000 | $140,000 |
| 2015 | $2,925 | $223,600 | $82,000 | $141,600 |
| 2014 | $2,591 | $206,000 | $79,600 | $126,400 |
Source: Public Records
Map
Nearby Homes
Your Personal Tour Guide
Ask me questions while you tour the home.