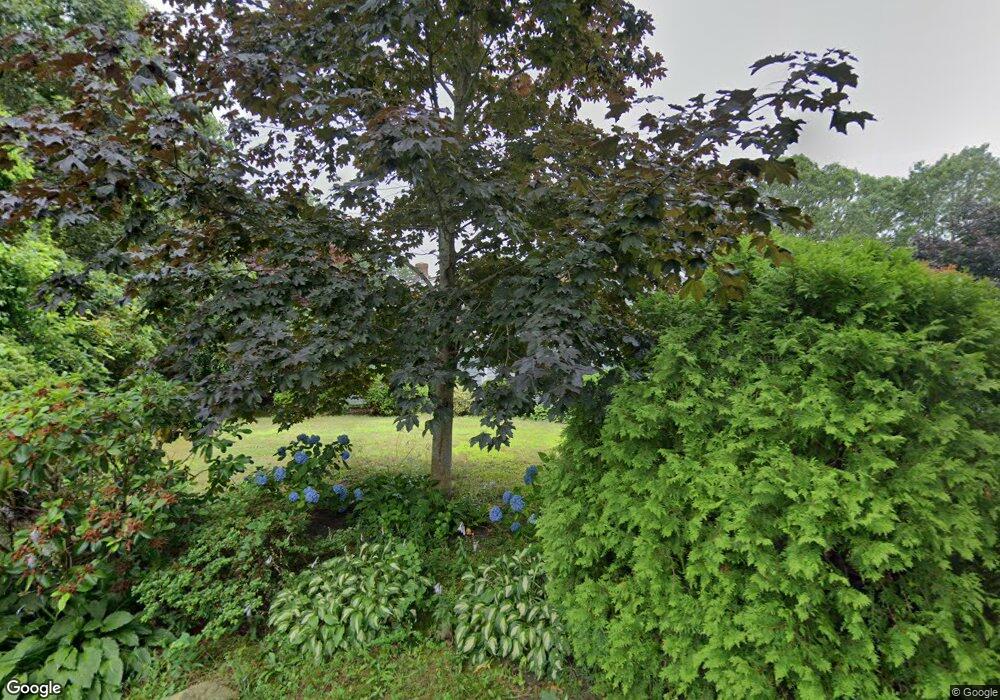
188 Tahanto Rd Pocasset, MA 02559
Pocasset NeighborhoodEstimated Value: $1,063,000 - $1,288,038
4
Beds
5
Baths
3,255
Sq Ft
$372/Sq Ft
Est. Value
About This Home
This home is located at 188 Tahanto Rd, Pocasset, MA 02559 and is currently estimated at $1,211,010, approximately $372 per square foot. 188 Tahanto Rd is a home located in Barnstable County with nearby schools including Bourne High School, Cadence Academy Preschool - Bourne, and St Margaret Regional School.
Ownership History
Date
Name
Owned For
Owner Type
Purchase Details
Closed on
Sep 28, 2011
Sold by
Inzalaco Frank C and Inzalaco Rosalinda
Bought by
Ciampa John A
Current Estimated Value
Purchase Details
Closed on
May 19, 1995
Sold by
Proctor Richard W and Proctor Nancy H
Bought by
Inzalaco Frank C and Inzalaco Roslinda
Create a Home Valuation Report for This Property
The Home Valuation Report is an in-depth analysis detailing your home's value as well as a comparison with similar homes in the area
Home Values in the Area
Average Home Value in this Area
Purchase History
| Date | Buyer | Sale Price | Title Company |
|---|---|---|---|
| Ciampa John A | $555,000 | -- | |
| Ciampa John A | $555,000 | -- | |
| Inzalaco Frank C | $100,900 | -- | |
| Inzalaco Frank C | $100,900 | -- |
Source: Public Records
Mortgage History
| Date | Status | Borrower | Loan Amount |
|---|---|---|---|
| Previous Owner | Inzalaco Frank C | $386,000 | |
| Previous Owner | Inzalaco Frank C | $250,000 | |
| Previous Owner | Inzalaco Frank C | $100,000 |
Source: Public Records
Tax History Compared to Growth
Tax History
| Year | Tax Paid | Tax Assessment Tax Assessment Total Assessment is a certain percentage of the fair market value that is determined by local assessors to be the total taxable value of land and additions on the property. | Land | Improvement |
|---|---|---|---|---|
| 2025 | $8,376 | $1,072,500 | $317,800 | $754,700 |
| 2024 | $7,710 | $961,300 | $302,600 | $658,700 |
| 2023 | $7,558 | $857,900 | $267,800 | $590,100 |
| 2022 | $6,893 | $683,200 | $214,800 | $468,400 |
| 2021 | $6,698 | $621,900 | $195,500 | $426,400 |
| 2020 | $6,526 | $607,600 | $193,600 | $414,000 |
| 2019 | $6,141 | $584,300 | $193,600 | $390,700 |
| 2018 | $5,586 | $530,000 | $184,400 | $345,600 |
| 2017 | $5,495 | $533,500 | $182,700 | $350,800 |
| 2016 | $5,335 | $525,100 | $182,700 | $342,400 |
| 2015 | $5,288 | $525,100 | $182,700 | $342,400 |
Source: Public Records
Map
Nearby Homes