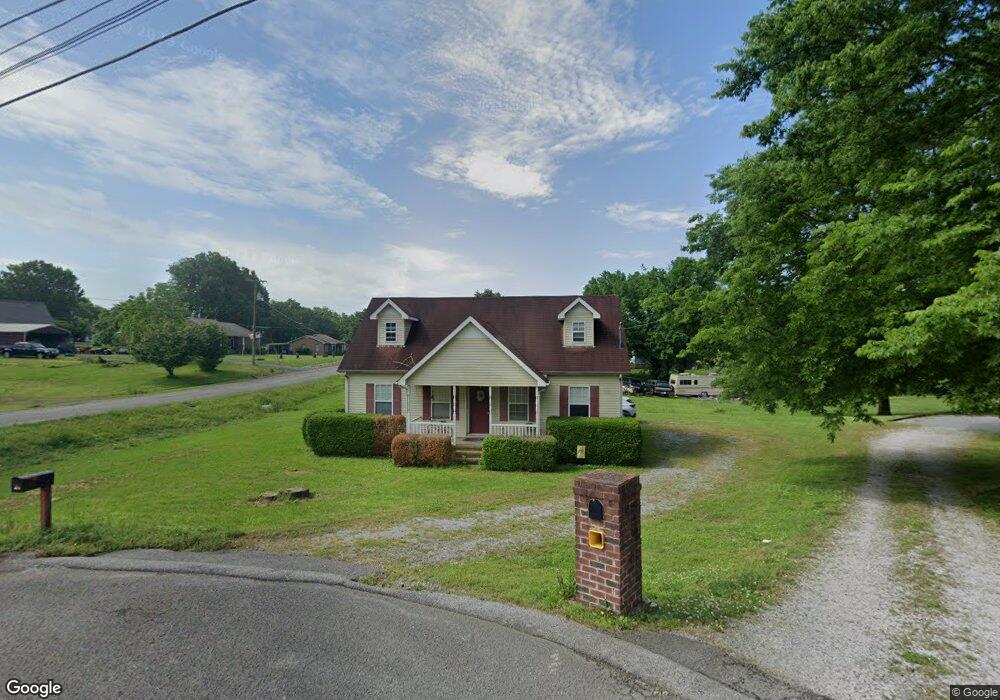
188 Tyne Rd Shelbyville, TN 37160
Estimated Value: $239,000 - $323,000
--
Bed
2
Baths
1,622
Sq Ft
$175/Sq Ft
Est. Value
About This Home
This home is located at 188 Tyne Rd, Shelbyville, TN 37160 and is currently estimated at $284,504, approximately $175 per square foot. 188 Tyne Rd is a home located in Bedford County with nearby schools including South Side Elementary School, Harris Middle School, and Christian Chapel Academy.
Ownership History
Date
Name
Owned For
Owner Type
Purchase Details
Closed on
Oct 18, 2007
Sold by
National City Bank
Bought by
Costello Barbara A
Current Estimated Value
Purchase Details
Closed on
Feb 21, 2007
Sold by
Cash Elizabeth A
Bought by
National City Bank
Purchase Details
Closed on
Mar 8, 1999
Sold by
Parker Bobby Lee
Bought by
Leigh Steven D
Purchase Details
Closed on
Feb 5, 1993
Bought by
Parker Bobby Lee
Purchase Details
Closed on
Jun 6, 1990
Bought by
Gambill Gale
Create a Home Valuation Report for This Property
The Home Valuation Report is an in-depth analysis detailing your home's value as well as a comparison with similar homes in the area
Home Values in the Area
Average Home Value in this Area
Purchase History
| Date | Buyer | Sale Price | Title Company |
|---|---|---|---|
| Costello Barbara A | $78,000 | -- | |
| National City Bank | $71,460 | -- | |
| Leigh Steven D | $76,000 | -- | |
| Parker Bobby Lee | $32,000 | -- | |
| Gambill Gale | -- | -- |
Source: Public Records
Tax History Compared to Growth
Tax History
| Year | Tax Paid | Tax Assessment Tax Assessment Total Assessment is a certain percentage of the fair market value that is determined by local assessors to be the total taxable value of land and additions on the property. | Land | Improvement |
|---|---|---|---|---|
| 2025 | -- | $43,625 | $0 | $0 |
| 2024 | -- | $43,625 | $12,500 | $31,125 |
| 2023 | $1,660 | $43,625 | $12,500 | $31,125 |
| 2022 | $1,708 | $43,625 | $12,500 | $31,125 |
| 2021 | $1,551 | $43,625 | $12,500 | $31,125 |
| 2020 | $1,136 | $43,625 | $12,500 | $31,125 |
| 2019 | $1,136 | $25,625 | $5,250 | $20,375 |
| 2018 | $1,110 | $25,625 | $5,250 | $20,375 |
| 2017 | $1,110 | $25,625 | $5,250 | $20,375 |
| 2016 | $1,100 | $25,625 | $5,250 | $20,375 |
| 2015 | $1,099 | $25,625 | $5,250 | $20,375 |
| 2014 | $870 | $22,205 | $0 | $0 |
Source: Public Records
Map
Nearby Homes