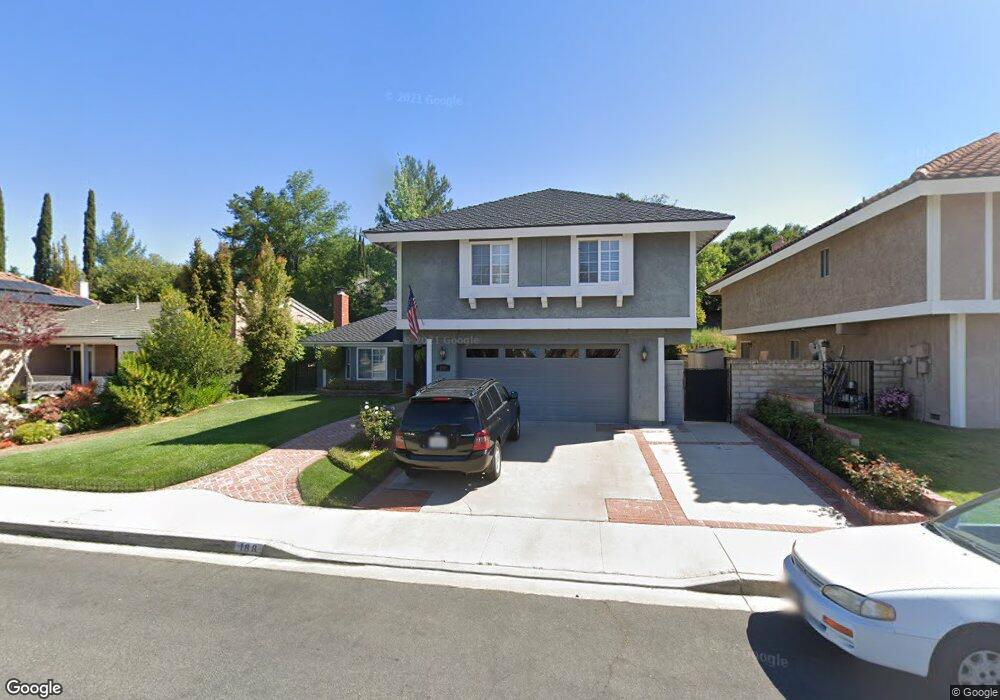
188 Windtree Ave Newbury Park, CA 91320
Estimated Value: $1,170,000 - $1,317,841
4
Beds
3
Baths
2,760
Sq Ft
$458/Sq Ft
Est. Value
About This Home
This home is located at 188 Windtree Ave, Newbury Park, CA 91320 and is currently estimated at $1,265,210, approximately $458 per square foot. 188 Windtree Ave is a home located in Ventura County with nearby schools including Aspen Elementary School, Redwood Middle School, and Sequoia Middle School.
Ownership History
Date
Name
Owned For
Owner Type
Purchase Details
Closed on
Nov 17, 2006
Sold by
Lervold Neil G
Bought by
Lervold Neil G and Lervold Kathie B
Current Estimated Value
Home Financials for this Owner
Home Financials are based on the most recent Mortgage that was taken out on this home.
Original Mortgage
$650,000
Outstanding Balance
$387,929
Interest Rate
6.37%
Mortgage Type
Purchase Money Mortgage
Estimated Equity
$877,281
Purchase Details
Closed on
Feb 4, 2002
Sold by
Sipos Neil Scott and Kazel Sipos Deborah Lee
Bought by
Lervold Neil G and Lervold Kathie B
Home Financials for this Owner
Home Financials are based on the most recent Mortgage that was taken out on this home.
Original Mortgage
$394,000
Interest Rate
6.85%
Purchase Details
Closed on
Oct 10, 1998
Sold by
Sipos Allen and Sipos Lois
Bought by
Sipos Neil Scott and Kazel Sipos Deborah Lee
Purchase Details
Closed on
Apr 28, 1995
Sold by
Emc Mtg Corp
Bought by
Sipos Allen and Sipos Lois
Purchase Details
Closed on
Jan 5, 1995
Sold by
Emc Mtg Corp and Harris John E
Bought by
Emc Mtg Corp
Create a Home Valuation Report for This Property
The Home Valuation Report is an in-depth analysis detailing your home's value as well as a comparison with similar homes in the area
Home Values in the Area
Average Home Value in this Area
Purchase History
| Date | Buyer | Sale Price | Title Company |
|---|---|---|---|
| Lervold Neil G | -- | Accommodation | |
| Lervold Neil G | -- | Gateway Title Company | |
| Lervold Neil G | $492,500 | First Southwestern Title Co | |
| Sipos Neil Scott | -- | -- | |
| Sipos Allen | $312,000 | Fidelity National Title | |
| Emc Mtg Corp | $320,000 | Stewart Title |
Source: Public Records
Mortgage History
| Date | Status | Borrower | Loan Amount |
|---|---|---|---|
| Open | Lervold Neil G | $650,000 | |
| Closed | Lervold Neil G | $394,000 |
Source: Public Records
Tax History Compared to Growth
Tax History
| Year | Tax Paid | Tax Assessment Tax Assessment Total Assessment is a certain percentage of the fair market value that is determined by local assessors to be the total taxable value of land and additions on the property. | Land | Improvement |
|---|---|---|---|---|
| 2025 | $8,460 | $727,543 | $291,014 | $436,529 |
| 2024 | $8,460 | $713,278 | $285,308 | $427,970 |
| 2023 | $8,214 | $699,293 | $279,714 | $419,579 |
| 2022 | $8,051 | $685,582 | $274,230 | $411,352 |
| 2021 | $7,889 | $672,140 | $268,853 | $403,287 |
| 2020 | $7,426 | $665,250 | $266,098 | $399,152 |
| 2019 | $7,228 | $652,207 | $260,881 | $391,326 |
| 2018 | $7,078 | $639,419 | $255,766 | $383,653 |
| 2017 | $6,934 | $626,882 | $250,751 | $376,131 |
| 2016 | $6,862 | $614,591 | $245,835 | $368,756 |
| 2015 | $6,736 | $605,362 | $242,144 | $363,218 |
| 2014 | -- | $593,505 | $237,401 | $356,104 |
Source: Public Records
Map
Nearby Homes
- 718 Pamela Wood St
- 325 Cherry Hills Ct
- 607 Valley Oak Ln
- 722 Blue Oak Ave
- 254 Greenmeadow Dr
- 816 Pamela Wood St
- 656 Blue Oak Ave
- 865 Palmgrove Ave
- 214 Poplar Crest Ave
- 224 Marjori Ave
- 603 Racquet Club Ln
- 559 Racquet Club Ln
- 1044 Larry Ct
- 216 Windrose Ct
- 1091 Amberton Ln Unit 58
- 1095 Amberton Ln
- 809 Shadow Lake Dr
- 1047 Mountain Oak Place
- 1193 Ramona Dr
- 769 Birchpark Cir Unit 203
- 200 Windtree Ave
- 176 Windtree Ave
- 220 Windtree Ave
- 164 Windtree Ave
- 152 Windtree Ave
- 232 Windtree Ave
- 662 Whispering Oaks Place
- 201 Windtree Ave
- 189 Windtree Ave
- 656 Whispering Oaks Place
- 668 Whispering Oaks Place
- 211 Windtree Ave
- 177 Windtree Ave
- 244 Windtree Ave
- 165 Windtree Ave
- 223 Windtree Ave
- 648 Cypress St
- 153 Windtree Ave
- 233 Windtree Ave
- 256 Windtree Ave