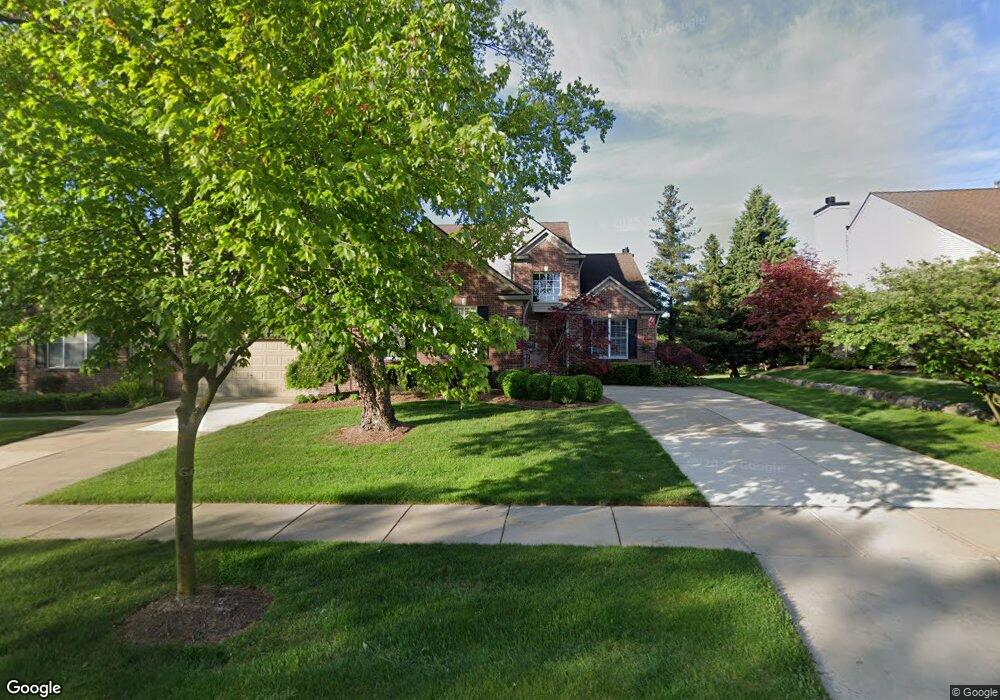
1880 Dunham Dr Rochester, MI 48306
Estimated Value: $495,024 - $576,000
3
Beds
3
Baths
2,501
Sq Ft
$219/Sq Ft
Est. Value
About This Home
This home is located at 1880 Dunham Dr, Rochester, MI 48306 and is currently estimated at $547,756, approximately $219 per square foot. 1880 Dunham Dr is a home located in Oakland County with nearby schools including Hart Middle School, Hugger Elementary School, and Stoney Creek High School.
Ownership History
Date
Name
Owned For
Owner Type
Purchase Details
Closed on
May 5, 2021
Sold by
Viles Donald E
Bought by
Viles Donald E and Fmt Nancy
Current Estimated Value
Home Financials for this Owner
Home Financials are based on the most recent Mortgage that was taken out on this home.
Original Mortgage
$158,800
Outstanding Balance
$120,225
Interest Rate
3.1%
Mortgage Type
New Conventional
Estimated Equity
$427,531
Purchase Details
Closed on
Apr 27, 2015
Sold by
Viles Donald E and Viles Nancy H
Bought by
Viles Donald E and Fam Nancy H Viles Joint
Purchase Details
Closed on
Mar 18, 2015
Sold by
Viles Donald E and Viles Nancy H
Bought by
Viles Donald E and Viles Nancy H
Purchase Details
Closed on
Sep 4, 2014
Sold by
Viles Donald E and Viles Nancy H
Bought by
Viles Donald E and Viles Nancy H
Purchase Details
Closed on
Jul 28, 1999
Sold by
Pulte Land Dev Corp
Bought by
Pulte Homes Of Mi
Create a Home Valuation Report for This Property
The Home Valuation Report is an in-depth analysis detailing your home's value as well as a comparison with similar homes in the area
Home Values in the Area
Average Home Value in this Area
Purchase History
| Date | Buyer | Sale Price | Title Company |
|---|---|---|---|
| Viles Donald E | -- | Leading Edge Title Agcy Llc | |
| Viles Donald E | -- | Leading Edge Title Agcy Llc | |
| Viles Donald E | -- | None Available | |
| Viles Donald E | -- | None Available | |
| Viles Donald E | -- | None Available | |
| Pulte Homes Of Mi | -- | -- |
Source: Public Records
Mortgage History
| Date | Status | Borrower | Loan Amount |
|---|---|---|---|
| Open | Viles Donald E | $158,800 |
Source: Public Records
Tax History Compared to Growth
Tax History
| Year | Tax Paid | Tax Assessment Tax Assessment Total Assessment is a certain percentage of the fair market value that is determined by local assessors to be the total taxable value of land and additions on the property. | Land | Improvement |
|---|---|---|---|---|
| 2024 | $4,370 | $224,090 | $0 | $0 |
| 2023 | $4,185 | $204,520 | $0 | $0 |
| 2022 | $4,452 | $195,090 | $0 | $0 |
| 2021 | $4,182 | $191,470 | $0 | $0 |
| 2020 | $3,927 | $185,330 | $0 | $0 |
| 2019 | $4,318 | $181,640 | $0 | $0 |
| 2018 | $4,299 | $175,840 | $0 | $0 |
| 2017 | $4,215 | $174,520 | $0 | $0 |
| 2016 | $4,081 | $169,210 | $0 | $0 |
| 2015 | -- | $150,560 | $0 | $0 |
| 2014 | -- | $131,780 | $0 | $0 |
| 2011 | -- | $110,380 | $0 | $0 |
Source: Public Records
Map
Nearby Homes
- 1983 Dunham Dr
- 628 Springview Dr Unit 120
- 1322 Copper Cir Unit 26
- 1955 Clearwood Ct Unit 665
- 674 Springview Dr
- 1600 Mill Race
- 877 Quarry
- 861 Quarry
- 6230 Winkler Mill Rd
- 2156 Willow Cir
- 1985 Monarch Dr Unit 7
- 2113 Marissa Way Unit 99
- 54673 Marissa Way Unit 93
- 2423 Buckthorn Dr
- 2583 Barberry Dr
- 767 E Bluff Ct Unit 7
- 2632 Hawthorne Dr S
- 2282 Kingscross Dr
- 620 Appoline Ct
- 54782 Whitby Way
- 1868 Dunham Dr
- 1892 Dunham Dr Unit 14
- 1892 Dunham Dr Unit 7, 14
- 1892 Dunham Dr
- 1871 Dunham Dr
- 1883 Dunham Dr
- 1856 Dunham Dr
- 1904 Dunham Dr
- 1859 Dunham Dr Unit 79
- 1859 Dunham Dr
- 1404 Welland Dr
- 1400 Welland Dr
- 1396 Welland Dr
- 1659 Maple Creek Ct
- 1659 Maple Creek Ct Unit 104
- 1390 Welland Dr
- 1901 Dunham Dr
- 1844 Dunham Dr
- 1414 Welland Dr
- 1384 Welland Dr