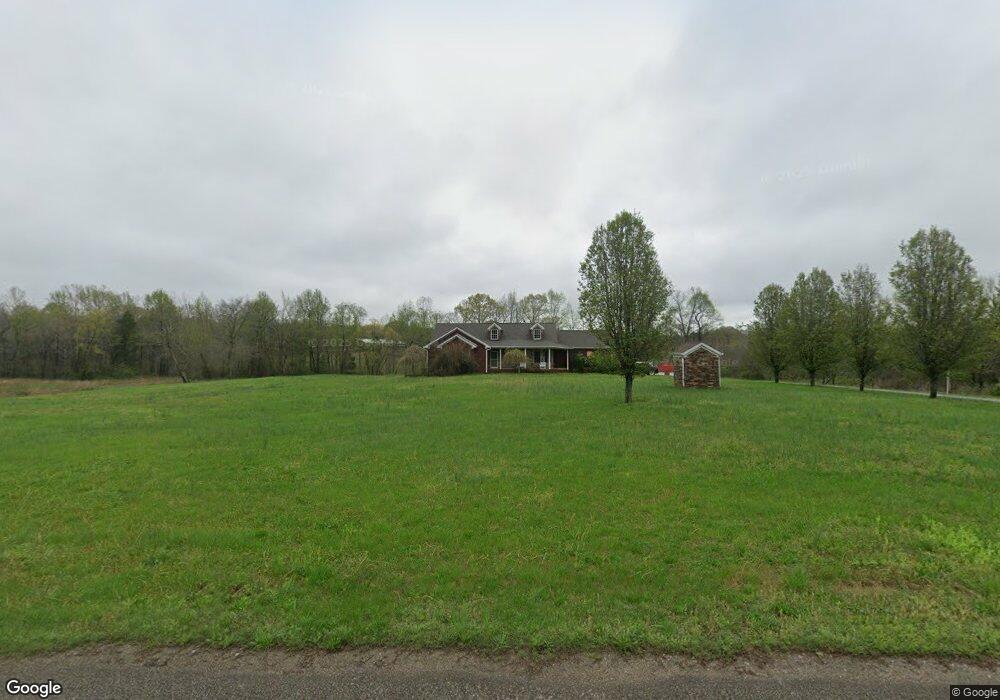
1880 Ebenezer Rd Camden, TN 38320
Estimated Value: $279,000 - $457,000
--
Bed
2
Baths
1,606
Sq Ft
$221/Sq Ft
Est. Value
About This Home
This home is located at 1880 Ebenezer Rd, Camden, TN 38320 and is currently estimated at $354,851, approximately $220 per square foot. 1880 Ebenezer Rd is a home located in Benton County with nearby schools including Camden Elementary School, Briarwood School, and Camden Junior High School.
Ownership History
Date
Name
Owned For
Owner Type
Purchase Details
Closed on
Feb 10, 2012
Sold by
Leonard Jonathan
Bought by
Leonard Linda
Current Estimated Value
Home Financials for this Owner
Home Financials are based on the most recent Mortgage that was taken out on this home.
Original Mortgage
$100,224
Outstanding Balance
$68,414
Interest Rate
3.89%
Mortgage Type
New Conventional
Estimated Equity
$286,437
Purchase Details
Closed on
Aug 26, 2008
Sold by
Leonard Donna Gail
Bought by
Leonard Shawn Robert
Purchase Details
Closed on
Oct 28, 2005
Sold by
Not Provided
Bought by
Leonard Shawn R and Leonard Donna
Home Financials for this Owner
Home Financials are based on the most recent Mortgage that was taken out on this home.
Original Mortgage
$35,000
Interest Rate
5.84%
Mortgage Type
Cash
Purchase Details
Closed on
Sep 1, 1987
Bought by
Walker Robert L
Create a Home Valuation Report for This Property
The Home Valuation Report is an in-depth analysis detailing your home's value as well as a comparison with similar homes in the area
Home Values in the Area
Average Home Value in this Area
Purchase History
| Date | Buyer | Sale Price | Title Company |
|---|---|---|---|
| Leonard Linda | $201,882 | -- | |
| Leonard Shawn Robert | -- | -- | |
| Leonard Shawn R | $35,000 | -- | |
| Walker Robert L | -- | -- |
Source: Public Records
Mortgage History
| Date | Status | Borrower | Loan Amount |
|---|---|---|---|
| Open | Leonard Linda | $100,224 | |
| Previous Owner | Leonard Shawn R | $35,000 |
Source: Public Records
Tax History Compared to Growth
Tax History
| Year | Tax Paid | Tax Assessment Tax Assessment Total Assessment is a certain percentage of the fair market value that is determined by local assessors to be the total taxable value of land and additions on the property. | Land | Improvement |
|---|---|---|---|---|
| 2025 | $1,596 | $92,025 | $0 | $0 |
| 2024 | $1,596 | $58,500 | $4,375 | $54,125 |
| 2023 | $1,596 | $58,500 | $4,375 | $54,125 |
| 2022 | $1,596 | $58,500 | $4,375 | $54,125 |
| 2021 | $1,596 | $58,500 | $4,375 | $54,125 |
| 2020 | $1,597 | $58,500 | $4,375 | $54,125 |
| 2019 | $1,623 | $55,025 | $4,375 | $50,650 |
| 2018 | $1,623 | $55,025 | $4,375 | $50,650 |
| 2017 | $1,591 | $53,925 | $4,375 | $49,550 |
| 2016 | $1,591 | $53,925 | $4,375 | $49,550 |
| 2015 | $1,612 | $53,925 | $4,375 | $49,550 |
| 2014 | $1,460 | $53,925 | $4,375 | $49,550 |
| 2013 | $1,460 | $49,658 | $0 | $0 |
Source: Public Records
Map
Nearby Homes
- 175 Rolling Oak Dr
- 540 Rolling Oak Dr
- 3636 Reynoldsburg Rd
- 1530 Prince Rd
- 0 Liberty Rd Unit RTC3034829
- 0 Hwy 641 N Unit 134811
- 0 Hwy 641 N Unit RTC2699308
- 0 Hwy 641 N Unit 124817
- 0 Hwy 641 N Unit 131394
- 4820 Highway 641 N
- 1105 Ballard Rd
- 309 Asbury Rd
- 0 Asbury Rd
- 2905 Old Highway 69
- 000 Cedar Dr
- 0 Cedar Dr
- 0 Highway 641 N
- 2250 Highway 69a
- 00 Liberty Rd
- 520 Bethel Farm Loop
- 2050 Ebenezer Rd
- 2105 Ebenezer Rd
- 2163 Ebenezer Rd
- 2115 Reynoldsburg Rd
- 1600 Ebenezer Rd
- 2325 Ebenezer Rd
- 1550 Ebenezer Rd
- 2110 Reynoldsburg Rd
- 1901 Reynoldsburg Rd
- 1017 Joe Corbitt Rd
- 1560 Lankford Arnold Rd
- 323 Joe Corbitt Rd
- 1345 Ebenezer Rd
- 1361 Ebenezer Rd
- 1884 Reynoldsburg Rd
- 1300 Ebenezer Rd
- 1684 Reynoldsburg Rd
- 955 Ebenezer Rd
- 2695 Reynoldsburg Rd
- 704 Joe Corbitt Rd