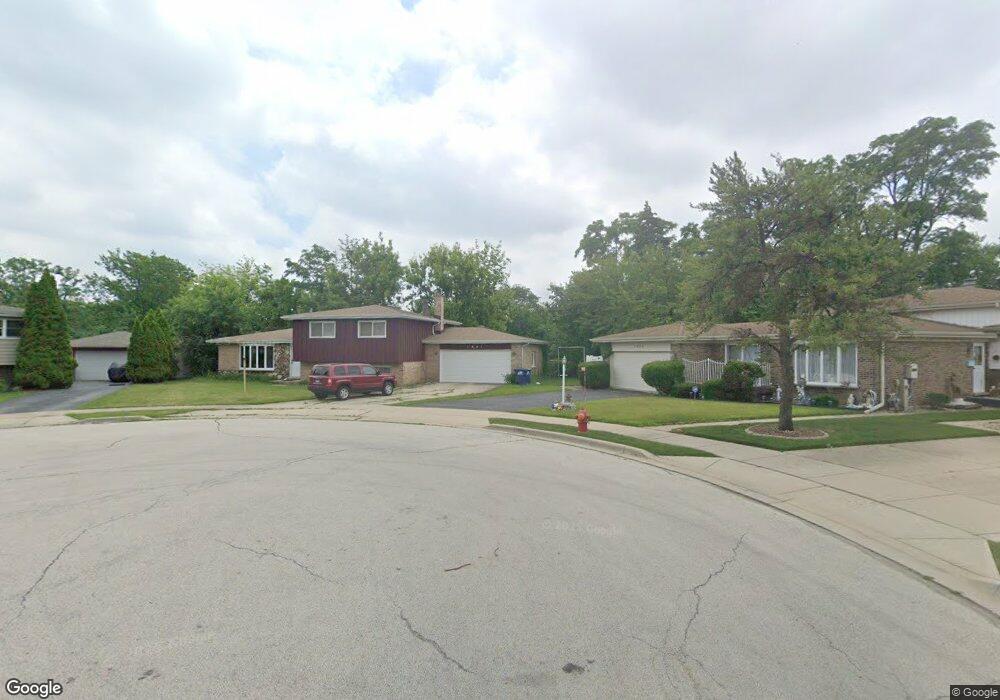
1881 Cedar Ct Des Plaines, IL 60018
Estimated Value: $362,000 - $426,000
3
Beds
2
Baths
1,271
Sq Ft
$306/Sq Ft
Est. Value
About This Home
This home is located at 1881 Cedar Ct, Des Plaines, IL 60018 and is currently estimated at $389,546, approximately $306 per square foot. 1881 Cedar Ct is a home located in Cook County with nearby schools including South Elementary School, Algonquin Middle School, and Maine West High School.
Ownership History
Date
Name
Owned For
Owner Type
Purchase Details
Closed on
Apr 11, 2006
Sold by
Chicago Title Land Trust Company
Bought by
Balitaan Enrique P and Balitaan El Cid F
Current Estimated Value
Home Financials for this Owner
Home Financials are based on the most recent Mortgage that was taken out on this home.
Original Mortgage
$187,700
Interest Rate
4.62%
Mortgage Type
New Conventional
Purchase Details
Closed on
Apr 4, 2005
Sold by
Balitaan Enrique P and Balitaan Remedios F
Bought by
Balitaan Enrique P and Balitaan Eric F
Purchase Details
Closed on
Sep 14, 2000
Sold by
Balitaan El Cid F
Bought by
Balitaan El Cid F
Purchase Details
Closed on
Sep 7, 1993
Sold by
Balitaan Enrique P and Balitaan Remedios F
Bought by
First Chicago Trust Company Of Illinois and Trust #Rv-012214
Create a Home Valuation Report for This Property
The Home Valuation Report is an in-depth analysis detailing your home's value as well as a comparison with similar homes in the area
Home Values in the Area
Average Home Value in this Area
Purchase History
| Date | Buyer | Sale Price | Title Company |
|---|---|---|---|
| Balitaan Enrique P | -- | Multiple | |
| Balitaan Enrique P | -- | -- | |
| Balitaan El Cid F | -- | None Listed On Document | |
| First Chicago Trust Company Of Illinois | -- | -- |
Source: Public Records
Mortgage History
| Date | Status | Borrower | Loan Amount |
|---|---|---|---|
| Previous Owner | Balitaan Enrique P | $187,700 |
Source: Public Records
Tax History
| Year | Tax Paid | Tax Assessment Tax Assessment Total Assessment is a certain percentage of the fair market value that is determined by local assessors to be the total taxable value of land and additions on the property. | Land | Improvement |
|---|---|---|---|---|
| 2025 | $3,138 | $38,000 | $4,809 | $33,191 |
| 2024 | $3,138 | $30,000 | $4,007 | $25,993 |
| 2023 | $3,160 | $30,000 | $4,007 | $25,993 |
| 2022 | $3,160 | $30,000 | $4,007 | $25,993 |
| 2021 | $3,675 | $29,677 | $3,339 | $26,338 |
| 2020 | $3,366 | $29,677 | $3,339 | $26,338 |
| 2019 | $3,313 | $33,345 | $3,339 | $30,006 |
| 2018 | $3,689 | $22,765 | $2,938 | $19,827 |
| 2017 | $3,560 | $22,765 | $2,938 | $19,827 |
| 2016 | $4,154 | $23,889 | $2,938 | $20,951 |
| 2015 | $4,747 | $20,843 | $2,537 | $18,306 |
| 2014 | $4,550 | $20,843 | $2,537 | $18,306 |
| 2013 | $4,626 | $20,248 | $2,537 | $17,711 |
Source: Public Records
Map
Nearby Homes
- 1721 Prospect Ave
- 1640 S River Rd
- 1922 Fargo Ave
- 1645 Illinois St
- 1990 Berry Ln
- 1689 S Elm St
- 1445 Everett Ave
- 1696 S Elm St
- 1700 E Forest Ave
- 38 E Touhy Ave
- 700 Florence Dr
- 1641 E Touhy Ave
- 1629 E Touhy Ave
- 2469 Parkwood Ln
- 1370 Fargo Ave Unit E
- 2220 S Chestnut St
- 2600 S Scott St
- 22 Park Ln Unit 220
- 2609 Eisenhower Dr
- 300 Boardwalk Place Unit T300
Your Personal Tour Guide
Ask me questions while you tour the home.