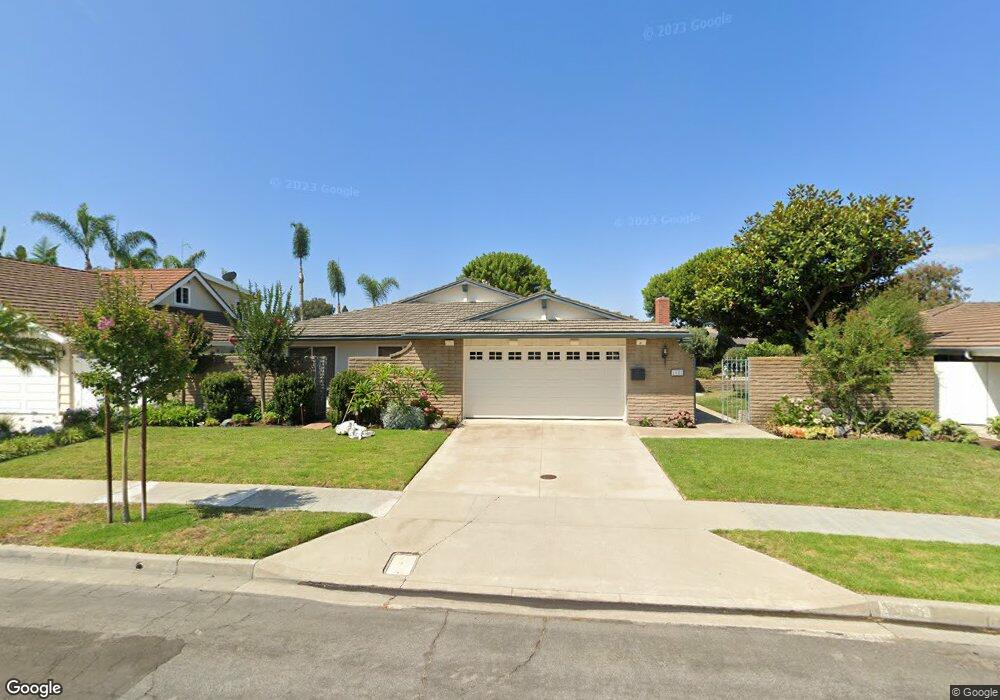
1881 Maui Cir Costa Mesa, CA 92626
Mesa Verde NeighborhoodEstimated Value: $1,788,493 - $2,412,000
4
Beds
2
Baths
2,042
Sq Ft
$1,012/Sq Ft
Est. Value
About This Home
This home is located at 1881 Maui Cir, Costa Mesa, CA 92626 and is currently estimated at $2,066,123, approximately $1,011 per square foot. 1881 Maui Cir is a home located in Orange County with nearby schools including California Elementary School, Charles W. Tewinkle Middle School, and Estancia High School.
Ownership History
Date
Name
Owned For
Owner Type
Purchase Details
Closed on
Oct 10, 2014
Sold by
Long Lilian G
Bought by
Long Lilian G and Severyn J Long & Lilian G Long Family Tr
Current Estimated Value
Purchase Details
Closed on
Jun 9, 2011
Sold by
Long Lilian G
Bought by
Long Lilian G and The Severyn J & Lilian G Long Family Tr
Purchase Details
Closed on
Mar 24, 2005
Sold by
Long Severyn J and Long Lilian G
Bought by
Long Lilian G
Home Financials for this Owner
Home Financials are based on the most recent Mortgage that was taken out on this home.
Original Mortgage
$283,000
Interest Rate
5.12%
Mortgage Type
Purchase Money Mortgage
Purchase Details
Closed on
Dec 18, 1996
Sold by
Long Severyn J and Long Lilian Lilian
Bought by
Long Severyn J and Long Lilian G
Create a Home Valuation Report for This Property
The Home Valuation Report is an in-depth analysis detailing your home's value as well as a comparison with similar homes in the area
Home Values in the Area
Average Home Value in this Area
Purchase History
| Date | Buyer | Sale Price | Title Company |
|---|---|---|---|
| Long Lilian G | -- | Servicelink | |
| Long Lilian G | -- | None Available | |
| Long Lilian G | -- | Stewart Title Of Ca Inc | |
| Long Severyn J | -- | -- |
Source: Public Records
Mortgage History
| Date | Status | Borrower | Loan Amount |
|---|---|---|---|
| Closed | Long Lilian G | $283,000 |
Source: Public Records
Tax History Compared to Growth
Tax History
| Year | Tax Paid | Tax Assessment Tax Assessment Total Assessment is a certain percentage of the fair market value that is determined by local assessors to be the total taxable value of land and additions on the property. | Land | Improvement |
|---|---|---|---|---|
| 2025 | $3,015 | $193,120 | $71,386 | $121,734 |
| 2024 | $3,015 | $189,334 | $69,986 | $119,348 |
| 2023 | $2,856 | $185,622 | $68,614 | $117,008 |
| 2022 | $2,657 | $181,983 | $67,269 | $114,714 |
| 2021 | $2,516 | $178,415 | $65,950 | $112,465 |
| 2020 | $2,477 | $176,586 | $65,274 | $111,312 |
| 2019 | $2,422 | $173,124 | $63,994 | $109,130 |
| 2018 | $2,373 | $169,730 | $62,739 | $106,991 |
| 2017 | $2,336 | $166,402 | $61,508 | $104,894 |
| 2016 | $2,291 | $163,140 | $60,302 | $102,838 |
| 2015 | $2,267 | $160,690 | $59,396 | $101,294 |
| 2014 | $2,219 | $157,543 | $58,233 | $99,310 |
Source: Public Records
Map
Nearby Homes
- 1878 Tahiti Dr
- 3008 Club House Cir
- 2952 Pemba Dr
- 1818 Samar Dr
- 1714 Labrador Dr
- 2871 Ellesmere Ave
- 3000 Country Club Dr
- 3109 Barbados Place
- 3133 Bermuda Dr
- 3104 Samoa Place
- 2798 Redwing Cir
- 1956 Flamingo Dr
- 19350 Ward St Unit 57
- 19350 Ward St Unit 97
- 19350 Ward St Unit 38
- 19350 Ward St Unit 14
- 19350 Ward St Unit 52
- 3119 Gibraltar Ave
- 1585 Baker St
- 2055 Calvert Ave