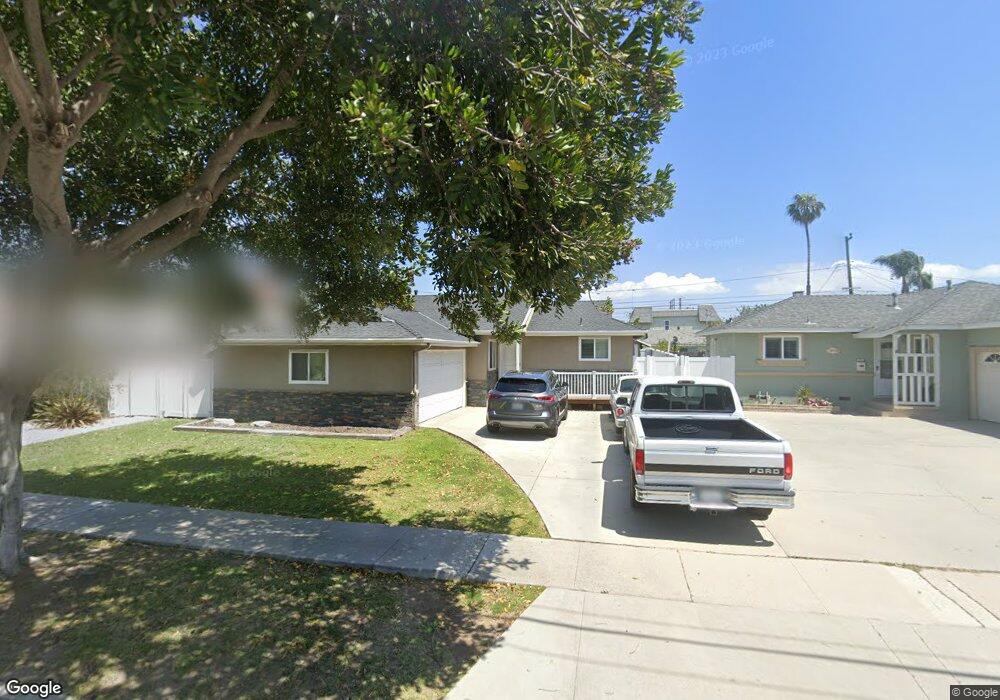
18812 Yukon Ave Torrance, CA 90504
North Torrance NeighborhoodEstimated Value: $929,442 - $1,042,000
3
Beds
2
Baths
1,183
Sq Ft
$837/Sq Ft
Est. Value
About This Home
This home is located at 18812 Yukon Ave, Torrance, CA 90504 and is currently estimated at $989,611, approximately $836 per square foot. 18812 Yukon Ave is a home located in Los Angeles County with nearby schools including Yukon Elementary School, Philip Magruder Middle School, and North High School.
Ownership History
Date
Name
Owned For
Owner Type
Purchase Details
Closed on
Jun 14, 2011
Sold by
Robinson Gregory W
Bought by
Robinson Gregory W and Robinson Heather S
Current Estimated Value
Home Financials for this Owner
Home Financials are based on the most recent Mortgage that was taken out on this home.
Original Mortgage
$240,000
Outstanding Balance
$164,906
Interest Rate
4.56%
Mortgage Type
New Conventional
Estimated Equity
$824,705
Purchase Details
Closed on
Nov 27, 2002
Sold by
Robinson Heather S
Bought by
Robinson Gregory W
Home Financials for this Owner
Home Financials are based on the most recent Mortgage that was taken out on this home.
Original Mortgage
$240,000
Interest Rate
4.62%
Mortgage Type
Purchase Money Mortgage
Purchase Details
Closed on
Dec 18, 1998
Sold by
And Mary Hardy Trust Hardy Donald F And Mary
Bought by
Robinson Gregory W
Home Financials for this Owner
Home Financials are based on the most recent Mortgage that was taken out on this home.
Original Mortgage
$176,700
Interest Rate
6.63%
Create a Home Valuation Report for This Property
The Home Valuation Report is an in-depth analysis detailing your home's value as well as a comparison with similar homes in the area
Home Values in the Area
Average Home Value in this Area
Purchase History
| Date | Buyer | Sale Price | Title Company |
|---|---|---|---|
| Robinson Gregory W | -- | Orange Coast Title | |
| Robinson Gregory W | -- | Ticor Title Insurance | |
| Robinson Gregory W | $186,000 | Gateway Title |
Source: Public Records
Mortgage History
| Date | Status | Borrower | Loan Amount |
|---|---|---|---|
| Open | Robinson Gregory W | $240,000 | |
| Closed | Robinson Gregory W | $240,000 | |
| Closed | Robinson Gregory W | $176,700 |
Source: Public Records
Tax History Compared to Growth
Tax History
| Year | Tax Paid | Tax Assessment Tax Assessment Total Assessment is a certain percentage of the fair market value that is determined by local assessors to be the total taxable value of land and additions on the property. | Land | Improvement |
|---|---|---|---|---|
| 2025 | $4,287 | $355,600 | $279,039 | $76,561 |
| 2024 | $4,287 | $348,628 | $273,568 | $75,060 |
| 2023 | $4,212 | $341,793 | $268,204 | $73,589 |
| 2022 | $4,157 | $335,093 | $262,946 | $72,147 |
| 2021 | $4,079 | $328,524 | $257,791 | $70,733 |
| 2019 | $3,964 | $318,782 | $250,146 | $68,636 |
| 2018 | $3,790 | $312,533 | $245,242 | $67,291 |
| 2016 | $3,618 | $300,399 | $235,720 | $64,679 |
| 2015 | $3,540 | $295,888 | $232,180 | $63,708 |
| 2014 | $3,456 | $290,093 | $227,632 | $62,461 |
Source: Public Records
Map
Nearby Homes
- 3615 W 187th St
- 3420 W 186th St
- 18309 Faysmith Ave
- 3349 W 183rd St
- 3133 W 187th Place
- 3717 W 182nd St
- 3826 W 185th St
- 18403 Eriel Ave
- 3910 W 182nd St Unit 1
- 18028 Falda Ave
- 3151 W 182nd St
- 17820 Florwood Ave
- North Pointe Plan at North Pointe
- 4101 W 184th St
- 17805 Florwood Ave
- 17826 Osage Ave
- 17405 Kornblum Ave
- 17511 Delia Ave
- 3838 W 176th Ct
- 18301 Purche Ave
- 18808 Yukon Ave
- 18816 Yukon Ave
- 18804 Yukon Ave
- 18820 Yukon Ave
- 18811 Patronella Ave
- 18815 Patronella Ave
- 18807 Patronella Ave
- 18819 Patronella Ave
- 18803 Patronella Ave
- 18714 Yukon Ave
- 18824 Yukon Ave
- 18803 Yukon Ave
- 18807 Yukon Ave
- 18823 Patronella Ave
- 18717 Yukon Ave
- 18715 Patronella Ave
- 18811 Yukon Ave
- 18710 Yukon Ave
- 18828 Yukon Ave
- 18713 Yukon Ave