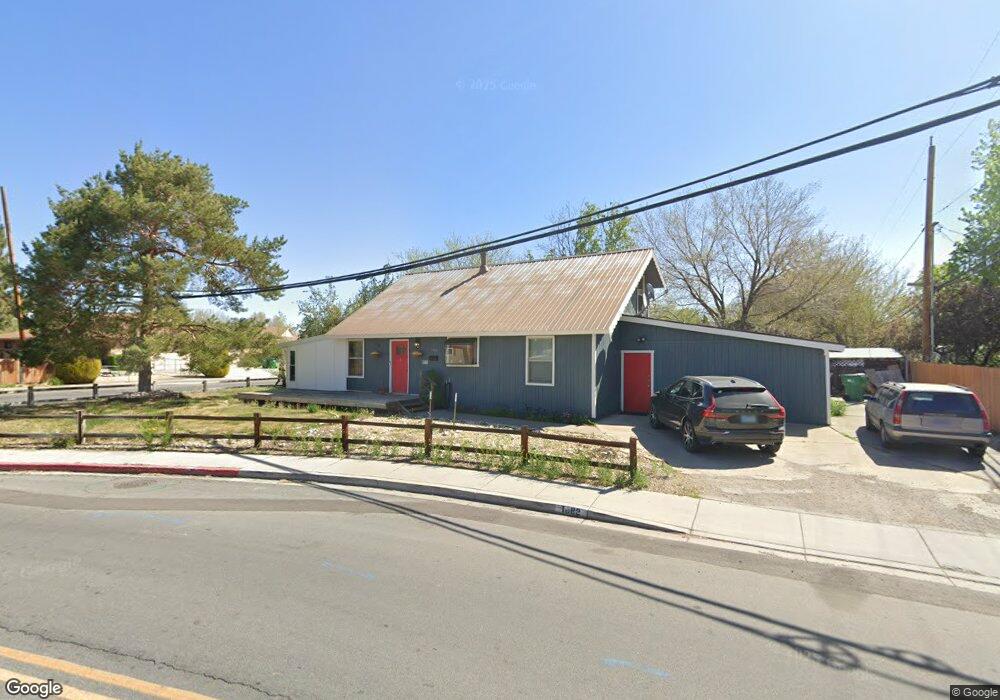
1882 11th St Sparks, NV 89431
North Rock NeighborhoodEstimated Value: $387,000 - $437,000
2
Beds
1
Bath
1,188
Sq Ft
$343/Sq Ft
Est. Value
About This Home
This home is located at 1882 11th St, Sparks, NV 89431 and is currently estimated at $407,575, approximately $343 per square foot. 1882 11th St is a home located in Washoe County with nearby schools including Alice Maxwell Elementary School, Sparks Middle School, and Sparks High School.
Ownership History
Date
Name
Owned For
Owner Type
Purchase Details
Closed on
Apr 19, 2022
Sold by
Noble Peter
Bought by
Noble Peter
Current Estimated Value
Home Financials for this Owner
Home Financials are based on the most recent Mortgage that was taken out on this home.
Original Mortgage
$207,250
Outstanding Balance
$196,141
Interest Rate
5%
Estimated Equity
$211,434
Purchase Details
Closed on
Dec 27, 2000
Sold by
Constante Michael S
Bought by
Noble Peter
Home Financials for this Owner
Home Financials are based on the most recent Mortgage that was taken out on this home.
Original Mortgage
$96,700
Interest Rate
7.71%
Purchase Details
Closed on
Oct 26, 1995
Sold by
Hayes Christopher K and Hayes Kim D
Bought by
Constante Michael S
Home Financials for this Owner
Home Financials are based on the most recent Mortgage that was taken out on this home.
Original Mortgage
$96,400
Interest Rate
7.59%
Purchase Details
Closed on
Jun 25, 1994
Sold by
Welch James J and Welch Barbara
Bought by
Welch Charles J
Create a Home Valuation Report for This Property
The Home Valuation Report is an in-depth analysis detailing your home's value as well as a comparison with similar homes in the area
Home Values in the Area
Average Home Value in this Area
Purchase History
| Date | Buyer | Sale Price | Title Company |
|---|---|---|---|
| Noble Peter | -- | Wfg National Title | |
| Noble Peter | -- | Wfg National Title | |
| Noble Peter | -- | Wfg National Title | |
| Noble Peter | $110,000 | Stewart Title Northern Nevad | |
| Constante Michael S | -- | Stewart Title Northern Nevad | |
| Constante Michael S | $99,500 | First Centennial Title Co | |
| Welch Charles J | -- | Stewart Title | |
| Hayes Christopher K | $18,000 | Stewart Title |
Source: Public Records
Mortgage History
| Date | Status | Borrower | Loan Amount |
|---|---|---|---|
| Open | Noble Peter | $207,250 | |
| Closed | Noble Peter | $207,250 | |
| Previous Owner | Noble Peter | $96,700 | |
| Previous Owner | Constante Michael S | $96,400 |
Source: Public Records
Tax History Compared to Growth
Tax History
| Year | Tax Paid | Tax Assessment Tax Assessment Total Assessment is a certain percentage of the fair market value that is determined by local assessors to be the total taxable value of land and additions on the property. | Land | Improvement |
|---|---|---|---|---|
| 2025 | $1,775 | $65,625 | $31,325 | $34,300 |
| 2024 | $1,775 | $65,377 | $30,100 | $35,277 |
| 2023 | $1,646 | $53,522 | $29,890 | $23,632 |
| 2022 | $1,277 | $45,103 | $25,095 | $20,008 |
| 2021 | $1,184 | $37,057 | $16,765 | $20,292 |
| 2020 | $1,112 | $36,975 | $16,345 | $20,630 |
| 2019 | $1,060 | $35,885 | $15,890 | $19,995 |
| 2018 | $1,009 | $31,096 | $11,235 | $19,861 |
| 2017 | $972 | $30,280 | $10,150 | $20,130 |
| 2016 | $946 | $28,955 | $8,225 | $20,730 |
| 2015 | $947 | $28,192 | $7,140 | $21,052 |
| 2014 | $918 | $26,681 | $6,440 | $20,241 |
| 2013 | -- | $24,227 | $3,955 | $20,272 |
Source: Public Records
Map
Nearby Homes
- 1003 Sbragia Way
- 1124 Sbragia Way
- 1121 Greenbrae Dr
- 1705 9th St
- 1365 Prospect Ave
- 1110 Xman Way
- 1160 York Way
- 2154 Oppio St
- 1655 Byrd Dr
- 985 10th St
- 1345 Plymouth Way
- 1010 12th St
- 1125 Dodson Way
- 1595 York Way
- 1945 4th St Unit 32
- 1945 4th St Unit 33
- 1945 4th St Unit 10
- 1527 Steven Ct
- 1536 Irene Way
- 1560 Steven Ct Unit 2