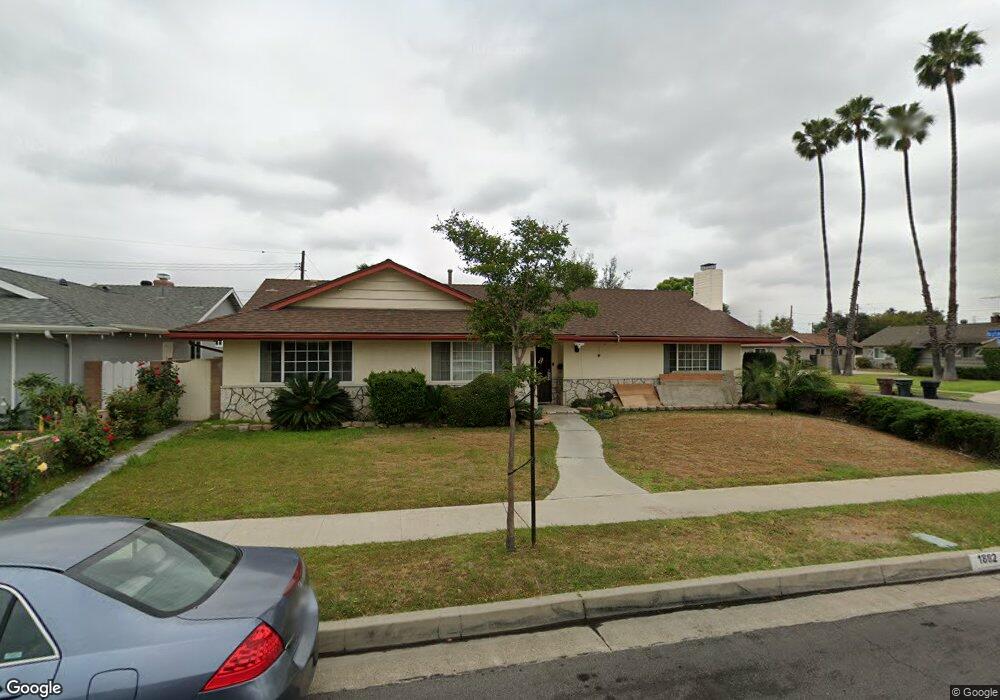
1882 W Lullaby Ln Anaheim, CA 92804
Hermosa Village NeighborhoodEstimated Value: $985,000 - $1,126,000
4
Beds
3
Baths
1,920
Sq Ft
$551/Sq Ft
Est. Value
About This Home
This home is located at 1882 W Lullaby Ln, Anaheim, CA 92804 and is currently estimated at $1,057,007, approximately $550 per square foot. 1882 W Lullaby Ln is a home located in Orange County with nearby schools including James Madison Elementary School, Ball Junior High School, and Loara High School.
Ownership History
Date
Name
Owned For
Owner Type
Purchase Details
Closed on
Apr 20, 2015
Sold by
Nguyen Anthony H and Nguyen Vivian M
Bought by
A & V Nguyen 2015 Family Trust
Current Estimated Value
Purchase Details
Closed on
Apr 24, 1998
Sold by
Le Huynh Mai Thi
Bought by
Nguyen Hoa Thai
Home Financials for this Owner
Home Financials are based on the most recent Mortgage that was taken out on this home.
Original Mortgage
$154,000
Outstanding Balance
$29,362
Interest Rate
7.15%
Estimated Equity
$1,027,645
Purchase Details
Closed on
Apr 7, 1998
Sold by
Nguyen Anthony H and Thai Hoa Thai
Bought by
Nguyen Anthony H and Nguyen My Hanh T
Home Financials for this Owner
Home Financials are based on the most recent Mortgage that was taken out on this home.
Original Mortgage
$154,000
Outstanding Balance
$29,362
Interest Rate
7.15%
Estimated Equity
$1,027,645
Purchase Details
Closed on
Feb 26, 1993
Sold by
Nguyen Trang K
Bought by
Nguyen Anthony H and Nguyen Hoa Thai
Create a Home Valuation Report for This Property
The Home Valuation Report is an in-depth analysis detailing your home's value as well as a comparison with similar homes in the area
Home Values in the Area
Average Home Value in this Area
Purchase History
| Date | Buyer | Sale Price | Title Company |
|---|---|---|---|
| A & V Nguyen 2015 Family Trust | -- | None Available | |
| Nguyen Hoa Thai | -- | First American Title Ins Co | |
| Nguyen Anthony H | -- | First American Title Ins Co | |
| Nguyen Anthony H | -- | -- |
Source: Public Records
Mortgage History
| Date | Status | Borrower | Loan Amount |
|---|---|---|---|
| Open | Nguyen Anthony H | $154,000 |
Source: Public Records
Tax History Compared to Growth
Tax History
| Year | Tax Paid | Tax Assessment Tax Assessment Total Assessment is a certain percentage of the fair market value that is determined by local assessors to be the total taxable value of land and additions on the property. | Land | Improvement |
|---|---|---|---|---|
| 2025 | $4,107 | $344,924 | $210,800 | $134,124 |
| 2024 | $4,107 | $338,161 | $206,666 | $131,495 |
| 2023 | $4,020 | $331,531 | $202,614 | $128,917 |
| 2022 | $3,967 | $325,031 | $198,641 | $126,390 |
| 2021 | $3,973 | $318,658 | $194,746 | $123,912 |
| 2020 | $3,956 | $315,391 | $192,749 | $122,642 |
| 2019 | $3,841 | $309,207 | $188,969 | $120,238 |
| 2018 | $3,763 | $303,145 | $185,264 | $117,881 |
| 2017 | $3,617 | $297,201 | $181,631 | $115,570 |
| 2016 | $3,606 | $291,374 | $178,070 | $113,304 |
| 2015 | $3,574 | $286,998 | $175,395 | $111,603 |
| 2014 | $3,357 | $281,377 | $171,960 | $109,417 |
Source: Public Records
Map
Nearby Homes
- 1944 W Lullaby Ln
- 1350 S Ashington Ln
- 1700 W Cerritos Ave Unit 216
- 2011 W Katella Ave Unit 61
- 1250 S Brookhurst St Unit 1059
- 1250 S Brookhurst St Unit 2028
- 1250 S Brookhurst St Unit 2080
- 1250 S Brookhurst St
- 1250 S Brookhurst St Unit 2033
- 930 S Emerald St
- 1675 W Mells Ln
- 1768 W Juno Ave
- 1645 S Euclid St
- 1737 S Garden Dr
- 1913 W Beacon Ave
- 1616 S Euclid St Unit 100
- 1616 S Euclid St Unit 75
- 1616 S Euclid St Unit 54
- 1616 S Euclid St Unit 23
- 10622 Tibbs Cir
- 1878 W Lullaby Ln
- 1883 W Cerritos Ave
- 1879 W Cerritos Ave
- 1447 S Nutwood St
- 1451 S Nutwood St
- 1872 W Lullaby Ln
- 1883 W Lullaby Ln
- 1873 W Cerritos Ave
- 1879 W Lullaby Ln
- 1457 S Nutwood St
- 1441 S Nutwood St
- 1868 W Lullaby Ln
- 1439 S Nutwood St
- 1873 W Lullaby Ln
- 1869 W Cerritos Ave
- 1446 S Ivanhoe St
- 1452 S Ivanhoe St
- 1869 W Lullaby Ln
- 1882 W Harriet Ln
- 1878 W Harriet Ln