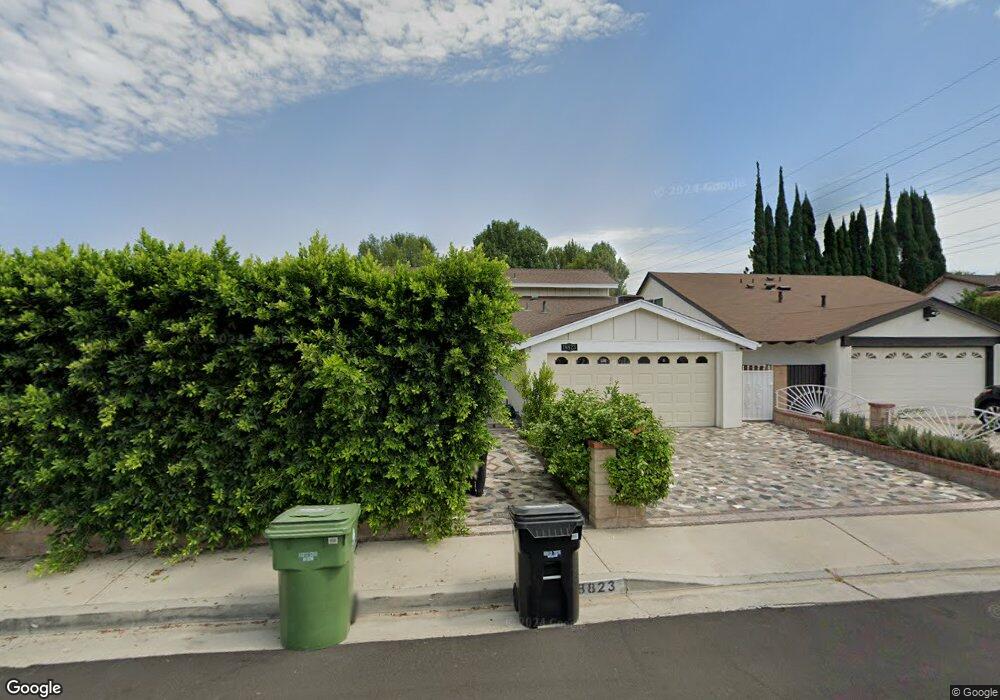
18823 Duncan St Tarzana, CA 91335
Estimated Value: $1,092,076 - $1,268,000
4
Beds
3
Baths
2,136
Sq Ft
$554/Sq Ft
Est. Value
About This Home
This home is located at 18823 Duncan St, Tarzana, CA 91335 and is currently estimated at $1,183,769, approximately $554 per square foot. 18823 Duncan St is a home located in Los Angeles County with nearby schools including Vanalden Avenue Elementary, Gaspar De Portola Middle School, and Reseda High School.
Ownership History
Date
Name
Owned For
Owner Type
Purchase Details
Closed on
Oct 13, 2011
Sold by
Tchapanian Azat M and Tchapanian Anoush B
Bought by
Eapen Sumitha Kulangottu
Current Estimated Value
Home Financials for this Owner
Home Financials are based on the most recent Mortgage that was taken out on this home.
Original Mortgage
$446,167
Outstanding Balance
$299,120
Interest Rate
3.75%
Mortgage Type
FHA
Estimated Equity
$884,649
Purchase Details
Closed on
Sep 30, 2011
Sold by
Thomas Shino
Bought by
Eapen Sumitha Kulangottu
Home Financials for this Owner
Home Financials are based on the most recent Mortgage that was taken out on this home.
Original Mortgage
$446,167
Outstanding Balance
$299,120
Interest Rate
3.75%
Mortgage Type
FHA
Estimated Equity
$884,649
Create a Home Valuation Report for This Property
The Home Valuation Report is an in-depth analysis detailing your home's value as well as a comparison with similar homes in the area
Home Values in the Area
Average Home Value in this Area
Purchase History
| Date | Buyer | Sale Price | Title Company |
|---|---|---|---|
| Eapen Sumitha Kulangottu | $465,000 | Advantage Title Inc | |
| Eapen Sumitha Kulangottu | -- | Advantage Title Inc |
Source: Public Records
Mortgage History
| Date | Status | Borrower | Loan Amount |
|---|---|---|---|
| Open | Eapen Sumitha Kulangottu | $446,167 |
Source: Public Records
Tax History Compared to Growth
Tax History
| Year | Tax Paid | Tax Assessment Tax Assessment Total Assessment is a certain percentage of the fair market value that is determined by local assessors to be the total taxable value of land and additions on the property. | Land | Improvement |
|---|---|---|---|---|
| 2025 | $7,292 | $584,053 | $213,272 | $370,781 |
| 2024 | $7,292 | $572,602 | $209,091 | $363,511 |
| 2023 | $7,150 | $561,376 | $204,992 | $356,384 |
| 2022 | $6,816 | $550,370 | $200,973 | $349,397 |
| 2021 | $6,720 | $539,580 | $197,033 | $342,547 |
| 2019 | $6,517 | $523,578 | $191,190 | $332,388 |
| 2018 | $6,389 | $513,313 | $187,442 | $325,871 |
| 2016 | $6,088 | $493,382 | $180,164 | $313,218 |
| 2015 | $6,000 | $485,972 | $177,458 | $308,514 |
| 2014 | $6,021 | $476,453 | $173,982 | $302,471 |
Source: Public Records
Map
Nearby Homes
- 18928 Victory Blvd
- 18937 Sylvan St
- 19046 Friar St
- 18931 Kittridge St Unit 73
- 19041 Hamlin St Unit 5
- 19036 Kittridge St Unit 1
- 6323 Reseda Blvd Unit 6
- 6625 Wilbur Ave Unit 13
- 6637 Capps Ave
- 6155 Reseda Blvd Unit 4
- 6545 Reseda Blvd Unit 19
- 18842 Lemay St
- 18721 Hatteras St Unit 10
- 6714 Amigo Ave
- 19145 Kittridge St
- 19208 Hamlin St Unit 5
- 6520 Tampa Ave Unit 6
- 18645 Hatteras St Unit 278
- 18645 Hatteras St Unit 237
- 18645 Hatteras St Unit 230
- 18817 Duncan St
- 18827 Duncan St
- 18811 Duncan St
- 6340 Crebs Ave
- 18816 Duncan St
- 6334 Crebs Ave
- 18810 Duncan St
- 6357 Crebs Ave
- 6351 Crebs Ave
- 6347 Crebs Ave
- 6330 Crebs Ave
- 6341 Crebs Ave
- 18817 Friar St
- 18811 Friar St
- 6337 Crebs Ave
- 6324 Crebs Ave
- 6349 Geyser Ave
- 6355 Geyser Ave
- 6343 Geyser Ave
- 6331 Crebs Ave