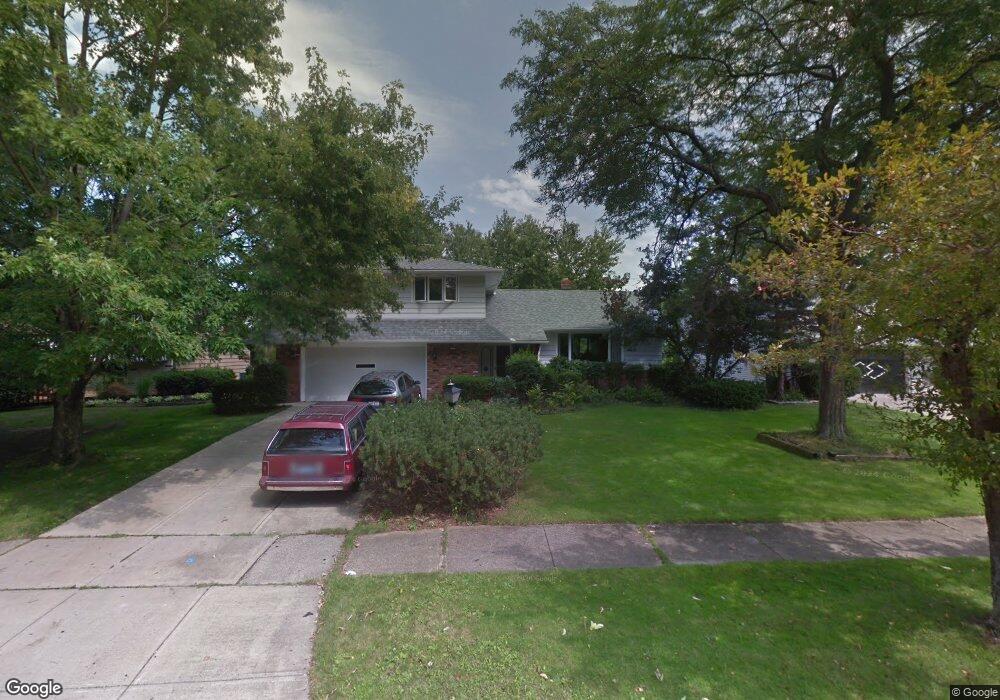
1883 Camberly Dr Cleveland, OH 44124
Estimated Value: $315,000 - $361,000
4
Beds
3
Baths
2,326
Sq Ft
$144/Sq Ft
Est. Value
About This Home
This home is located at 1883 Camberly Dr, Cleveland, OH 44124 and is currently estimated at $334,090, approximately $143 per square foot. 1883 Camberly Dr is a home located in Cuyahoga County with nearby schools including Sunview Elementary School, Greenview Upper Elementary School, and Memorial Junior High School.
Ownership History
Date
Name
Owned For
Owner Type
Purchase Details
Closed on
Feb 27, 2002
Sold by
Estate Of Jean Marie Miller
Bought by
Miller John L
Current Estimated Value
Purchase Details
Closed on
Dec 10, 1999
Sold by
Miller Jean M
Bought by
Miller John L and Miller Jean M
Home Financials for this Owner
Home Financials are based on the most recent Mortgage that was taken out on this home.
Original Mortgage
$132,500
Interest Rate
7.87%
Mortgage Type
Balloon
Purchase Details
Closed on
Dec 29, 1988
Sold by
Licker David A
Bought by
Miller John L
Purchase Details
Closed on
Oct 1, 1984
Sold by
Messerman Phyllis J
Bought by
Licker David A
Purchase Details
Closed on
Sep 15, 1978
Sold by
Messerman Terrence A and P J
Bought by
Messerman Phyllis J
Purchase Details
Closed on
Jan 1, 1975
Bought by
Messerman Terrence A and P J
Create a Home Valuation Report for This Property
The Home Valuation Report is an in-depth analysis detailing your home's value as well as a comparison with similar homes in the area
Home Values in the Area
Average Home Value in this Area
Purchase History
| Date | Buyer | Sale Price | Title Company |
|---|---|---|---|
| Miller John L | -- | -- | |
| Miller John L | -- | Tower City Title Agency Inc | |
| Miller John L | $147,400 | -- | |
| Licker David A | $118,500 | -- | |
| Messerman Phyllis J | -- | -- | |
| Messerman Terrence A | -- | -- |
Source: Public Records
Mortgage History
| Date | Status | Borrower | Loan Amount |
|---|---|---|---|
| Previous Owner | Miller John L | $132,500 |
Source: Public Records
Tax History Compared to Growth
Tax History
| Year | Tax Paid | Tax Assessment Tax Assessment Total Assessment is a certain percentage of the fair market value that is determined by local assessors to be the total taxable value of land and additions on the property. | Land | Improvement |
|---|---|---|---|---|
| 2024 | $5,478 | $87,500 | $17,255 | $70,245 |
| 2023 | $4,940 | $65,490 | $13,160 | $52,330 |
| 2022 | $4,947 | $65,490 | $13,160 | $52,330 |
| 2021 | $4,905 | $65,490 | $13,160 | $52,330 |
| 2020 | $5,002 | $59,540 | $11,970 | $47,570 |
| 2019 | $5,080 | $170,100 | $34,200 | $135,900 |
| 2018 | $5,005 | $59,540 | $11,970 | $47,570 |
| 2017 | $4,871 | $59,540 | $11,730 | $47,810 |
| 2016 | $5,519 | $67,100 | $11,730 | $55,370 |
| 2015 | $5,086 | $67,100 | $11,730 | $55,370 |
| 2014 | $5,086 | $62,730 | $10,960 | $51,770 |
Source: Public Records
Map
Nearby Homes
- 1842 Aldersgate Dr
- 1922 Winchester Rd
- 250 Eagle Point Dr
- 5560 Lansbury Ln
- 2112 Acacia Park Dr Unit 214
- 2112 Acacia Park Dr Unit 220
- 2112 Acacia Park Dr Unit 319
- 2112 Acacia Park Dr Unit 524
- 1857 Brainard Rd
- 1856 Bremerton Rd
- 1775 Brainard Rd
- 2202 Acacia Park Dr Unit 2714
- 2202 Acacia Park Dr Unit 2219
- 2202 Acacia Park Dr Unit 2605
- 5200 Three Village Dr Unit LLB
- 5200 Three Village Dr Unit 2FH
- 5200 Three Village Dr Unit 4K
- 1839 Caronia Dr
- 27500 Cedar Rd Unit 201
- 27500 Cedar Rd Unit 305
- 1875 Camberly Dr
- 1891 Camberly Dr
- 1882 Aldersgate Dr
- 1895 Camberly Dr
- 1867 Camberly Dr
- 1874 Aldersgate Dr
- 1890 Aldersgate Dr
- 1884 Camberly Dr
- 1866 Aldersgate Dr
- 1876 Camberly Dr
- 1890 Camberly Dr
- 1899 Camberly Dr
- 1859 Camberly Dr
- 1898 Aldersgate Dr
- 1894 Camberly Dr
- 1868 Camberly Dr
- 1858 Aldersgate Dr
- 1898 Camberly Dr
- 1860 Camberly Dr
- 1905 Camberly Dr