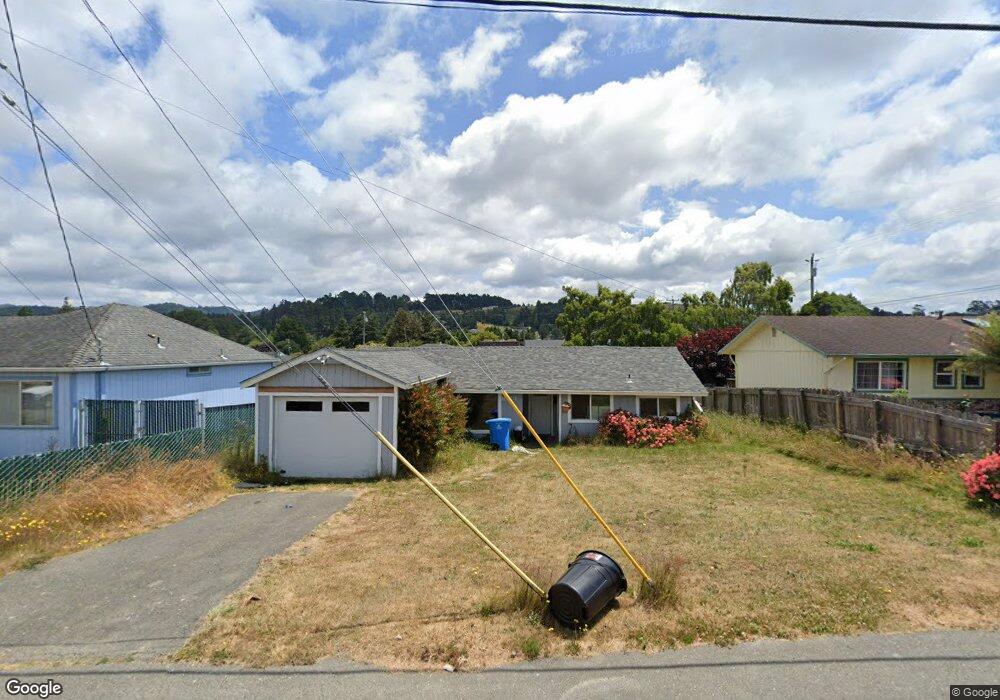
1883 Ronald Ave Fortuna, CA 95540
Estimated Value: $158,000 - $331,000
2
Beds
1
Bath
1,134
Sq Ft
$219/Sq Ft
Est. Value
About This Home
This home is located at 1883 Ronald Ave, Fortuna, CA 95540 and is currently estimated at $248,802, approximately $219 per square foot. 1883 Ronald Ave is a home located in Humboldt County with nearby schools including Fortuna Union High School, East High School, and Redwood Preparatory Charter School.
Ownership History
Date
Name
Owned For
Owner Type
Purchase Details
Closed on
Apr 28, 2021
Sold by
Lennon Neal P
Bought by
Small Max
Current Estimated Value
Home Financials for this Owner
Home Financials are based on the most recent Mortgage that was taken out on this home.
Original Mortgage
$91,000
Outstanding Balance
$82,293
Interest Rate
3.1%
Mortgage Type
Commercial
Estimated Equity
$166,509
Purchase Details
Closed on
Apr 21, 2021
Sold by
Smail Max
Bought by
Trent Christopher William and Trent Robin Ashleigh
Home Financials for this Owner
Home Financials are based on the most recent Mortgage that was taken out on this home.
Original Mortgage
$91,000
Outstanding Balance
$82,293
Interest Rate
3.1%
Mortgage Type
Commercial
Estimated Equity
$166,509
Purchase Details
Closed on
Jul 17, 2012
Sold by
Mcdonald Sherry L
Bought by
Lennon Neal P
Purchase Details
Closed on
Apr 2, 1999
Sold by
Bagley Sherry L and Bagley Sherry L
Bought by
Mcdonald Sherry L
Create a Home Valuation Report for This Property
The Home Valuation Report is an in-depth analysis detailing your home's value as well as a comparison with similar homes in the area
Home Values in the Area
Average Home Value in this Area
Purchase History
| Date | Buyer | Sale Price | Title Company |
|---|---|---|---|
| Small Max | $80,000 | Chicago Title Company | |
| Trent Christopher William | $91,000 | Chicago Title Company | |
| Lennon Neal P | $69,000 | None Available | |
| Mcdonald Sherry L | -- | Fidelity National Title Co | |
| Mcdonald Sherry L | -- | Fidelity National Title Co |
Source: Public Records
Mortgage History
| Date | Status | Borrower | Loan Amount |
|---|---|---|---|
| Open | Trent Christopher William | $91,000 |
Source: Public Records
Tax History Compared to Growth
Tax History
| Year | Tax Paid | Tax Assessment Tax Assessment Total Assessment is a certain percentage of the fair market value that is determined by local assessors to be the total taxable value of land and additions on the property. | Land | Improvement |
|---|---|---|---|---|
| 2025 | $1,471 | $135,302 | $108,242 | $27,060 |
| 2024 | $1,471 | $132,650 | $106,120 | $26,530 |
| 2023 | $1,444 | $130,050 | $104,040 | $26,010 |
| 2022 | $1,440 | $127,500 | $102,000 | $25,500 |
| 2021 | $1,703 | $151,299 | $85,319 | $65,980 |
| 2020 | $1,701 | $149,749 | $84,445 | $65,304 |
| 2019 | $1,671 | $146,814 | $82,790 | $64,024 |
| 2018 | $1,650 | $143,936 | $81,167 | $62,769 |
| 2017 | $1,573 | $141,115 | $79,576 | $61,539 |
| 2016 | $1,723 | $156,032 | $78,016 | $78,016 |
| 2015 | $771 | $71,654 | $23,883 | $47,771 |
| 2014 | $751 | $70,252 | $23,416 | $46,836 |
Source: Public Records
Map
Nearby Homes
- 3075 Campton Heights Dr
- 1757 Cecil Ave
- 1745 Thelma St
- 2755 Highland Dr
- 2725 Murray Ct
- 1594 Crest Dr
- 3310 School St
- 3251 Matthew Ln
- 1604 Imperial Way
- 2150 Drake Hill Rd
- 2550 W School St
- 184 Empire Dr
- 197 Empire Dr
- 1521 Imperial Way
- 185 Empire Dr
- 136 Castle Ct
- 160 Monarch Dr
- 1514 Crest Dr
- 00 View Dr
- 2208 Royal Dr
- 1891 Ronald Ave
- 1871 Ronald Ave
- 3151 Drake Hill Rd
- 1861 Ronald Ave
- 1878 Clara Ave
- 1880 Clara Ave
- 1888 Ronald Ave
- 1890 Ronald Ave
- 1874 Ronald Ave
- 1860 Clara Ave
- 1851 Ronald Ave
- 1860 Ronald Ave
- 1856 Clara Ave
- 1846 Ronald Ave
- 3037 Drake Hill Rd
- 1837 Ronald Ave
- 1873 Penn Ave
- 1891 Clara Ave
- 1865 Penn Ave
- 1846 Clara Ave