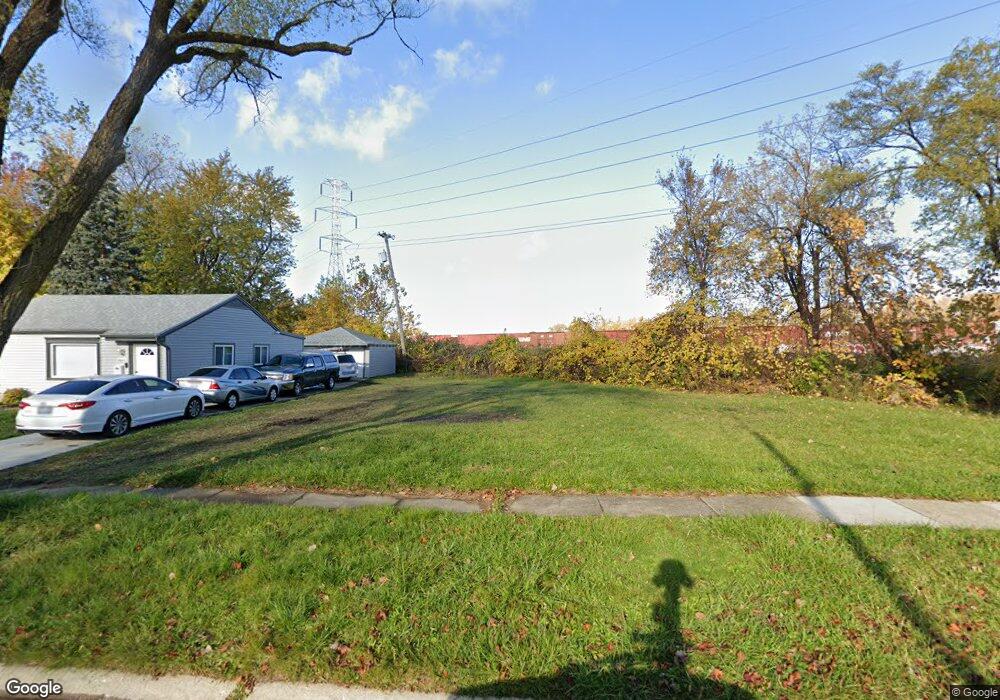
18833 Wall St Melvindale, MI 48122
Estimated Value: $86,000 - $193,000
Studio
1
Bath
819
Sq Ft
$170/Sq Ft
Est. Value
About This Home
This home is located at 18833 Wall St, Melvindale, MI 48122 and is currently estimated at $139,500, approximately $170 per square foot. 18833 Wall St is a home located in Wayne County with nearby schools including Rogers Early Elementary School, Allendale Elementary School, and Julian O. Strong Middle School.
Ownership History
Date
Name
Owned For
Owner Type
Purchase Details
Closed on
Mar 15, 2017
Sold by
City Of Melvindale
Bought by
The City Of Melvindale and Wayne Metropolitan Community Action Agen
Current Estimated Value
Purchase Details
Closed on
Feb 20, 2017
Sold by
Sabree Eric R
Bought by
Treasuer City Of Melvindale
Purchase Details
Closed on
Sep 29, 2016
Sold by
Ross Gail J
Bought by
City Of Melvinale
Purchase Details
Closed on
Aug 6, 2011
Sold by
Kroll Construction Co
Bought by
Ross Gail J
Purchase Details
Closed on
Dec 26, 2009
Sold by
Ross Dempster A
Bought by
Ross Gail J
Create a Home Valuation Report for This Property
The Home Valuation Report is an in-depth analysis detailing your home's value as well as a comparison with similar homes in the area
Home Values in the Area
Average Home Value in this Area
Purchase History
| Date | Buyer | Sale Price | Title Company |
|---|---|---|---|
| The City Of Melvindale | -- | None Available | |
| Treasuer City Of Melvindale | -- | None Available | |
| City Of Melvinale | -- | None Available | |
| Ross Gail J | $325 | None Available | |
| Ross Gail J | -- | None Available |
Source: Public Records
Tax History
| Year | Tax Paid | Tax Assessment Tax Assessment Total Assessment is a certain percentage of the fair market value that is determined by local assessors to be the total taxable value of land and additions on the property. | Land | Improvement |
|---|---|---|---|---|
| 2025 | -- | $0 | $0 | $0 |
| 2024 | -- | $0 | $0 | $0 |
| 2023 | -- | $0 | $0 | $0 |
| 2022 | -- | $0 | $0 | $0 |
| 2021 | $0 | $0 | $0 | $0 |
| 2020 | $215 | $0 | $0 | $0 |
| 2019 | $1,379 | $0 | $0 | $0 |
| 2018 | $0 | $0 | $0 | $0 |
| 2017 | $2,109 | $0 | $0 | $0 |
| 2016 | $2,733 | $22,700 | $0 | $0 |
| 2015 | $2,103 | $21,100 | $0 | $0 |
| 2013 | $2,070 | $21,500 | $0 | $0 |
| 2012 | $1,379 | $21,000 | $5,700 | $15,300 |
Source: Public Records
Map
Nearby Homes
- 2735 Margaret St
- 19120 Dix Rd
- 19504 Roger St
- 000 Harlow St
- 24558 Outer Dr
- 18634 Wood St
- 0002 Prospect St
- 001 Prospect St
- 17951 Prospect St
- 19167 Henry St
- 19550 Henry St
- 2190 Morris Ave
- 18624 Hanna St
- 1770 Council Ave
- 14721 Morris Ave
- 18811 Hanna St
- 15261 Demean Ave
- 2105 Morris Ave
- 2091 Morris Ave
- 19531 Wood St
Your Personal Tour Guide
Ask me questions while you tour the home.