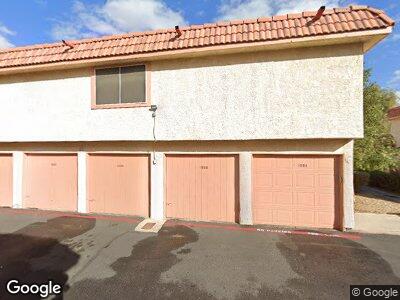
1884 Avacado Ct Henderson, NV 89014
Green Valley North NeighborhoodEstimated Value: $200,000 - $216,000
1
Bed
2
Baths
630
Sq Ft
$326/Sq Ft
Est. Value
About This Home
This home is located at 1884 Avacado Ct, Henderson, NV 89014 and is currently estimated at $205,490, approximately $326 per square foot. 1884 Avacado Ct is a home located in Clark County with nearby schools including Harriet Treem Elementary School, Jim Thorpe Elementary School, and Francis H Cortney Junior High School.
Ownership History
Date
Name
Owned For
Owner Type
Purchase Details
Closed on
Apr 1, 2019
Sold by
Scurry Anthony H
Bought by
Horn Kathleen M
Current Estimated Value
Purchase Details
Closed on
Feb 22, 2002
Sold by
Haraway Bryan C
Bought by
Scurry Anthony H
Home Financials for this Owner
Home Financials are based on the most recent Mortgage that was taken out on this home.
Original Mortgage
$58,971
Interest Rate
6.8%
Mortgage Type
FHA
Purchase Details
Closed on
Mar 28, 1997
Sold by
Herman Kenneth and Herman Hazel
Bought by
Haraway Bryan C
Home Financials for this Owner
Home Financials are based on the most recent Mortgage that was taken out on this home.
Original Mortgage
$49,731
Interest Rate
7.96%
Mortgage Type
FHA
Create a Home Valuation Report for This Property
The Home Valuation Report is an in-depth analysis detailing your home's value as well as a comparison with similar homes in the area
Home Values in the Area
Average Home Value in this Area
Purchase History
| Date | Buyer | Sale Price | Title Company |
|---|---|---|---|
| Horn Kathleen M | $117,000 | Stewart Title Company F | |
| Scurry Anthony H | -- | Stewart Title Company F | |
| Scurry Anthony H | $59,900 | Old Republic Title Company | |
| Haraway Bryan C | $51,000 | United Title |
Source: Public Records
Mortgage History
| Date | Status | Borrower | Loan Amount |
|---|---|---|---|
| Previous Owner | Scurry Anthony H | $82,000 | |
| Previous Owner | Scurry Anthony H | $78,500 | |
| Previous Owner | Scurry Anthony H | $58,971 | |
| Previous Owner | Haraway Bryan C | $49,731 |
Source: Public Records
Tax History Compared to Growth
Tax History
| Year | Tax Paid | Tax Assessment Tax Assessment Total Assessment is a certain percentage of the fair market value that is determined by local assessors to be the total taxable value of land and additions on the property. | Land | Improvement |
|---|---|---|---|---|
| 2025 | $358 | $33,948 | $21,350 | $12,598 |
| 2024 | $348 | $33,948 | $21,350 | $12,598 |
| 2023 | $348 | $36,430 | $24,500 | $11,930 |
| 2022 | $338 | $30,629 | $19,005 | $11,624 |
| 2021 | $328 | $27,621 | $17,500 | $10,121 |
| 2020 | $316 | $28,256 | $17,500 | $10,756 |
| 2019 | $312 | $24,860 | $14,000 | $10,860 |
| 2018 | $298 | $19,395 | $8,750 | $10,645 |
| 2017 | $507 | $17,476 | $6,650 | $10,826 |
| 2016 | $280 | $15,879 | $5,600 | $10,279 |
| 2015 | $278 | $12,794 | $3,850 | $8,944 |
| 2014 | $270 | $9,043 | $3,500 | $5,543 |
Source: Public Records
Map
Nearby Homes
- 2007 Cutlass Dr Unit 58
- 680 Cervantes Dr
- 1979 Cutlass Dr Unit 72
- 1969 Cutlass Dr Unit 77
- 1955 Cutlass Dr Unit 1955
- 1947 Cutlass Dr Unit 88
- 1951 Scimitar Dr
- 642 Cervantes Dr
- 614 Cervantes Dr Unit 49
- 741 Nectarine Ct Unit D
- 613 Cervantes Dr
- 718 Nectarine Ct Unit D
- 2462 Marlene Way
- 2700 Osborne Ln
- 759 Sunrise Crossing St
- 2416 Greens Ave
- 2428 Greens Ave
- 2425 Greens Ave
- 2507 Albemarle Way
- 780 Flowing Meadow Dr
- 1884 Avacado Ct Unit na
- 1884 Avacado Ct
- 1886 Avacado Ct Unit A
- 1888 Avacado Ct
- 1890 Avacado Ct
- 1890 Avacado Ct Unit D
- 1896 Avacado Ct
- 1898 Avacado Ct
- 1892 Avacado Ct
- 1894 Avacado Ct
- 1880 Avacado Ct
- 1882 Avacado Ct
- 1882 Avacado Ct Unit B
- 1878 Avacado Ct
- 1885 Avacado Ct Unit B
- 1891 Avacado Ct
- 1887 Avacado Ct Unit A
- 1876 Avacado Ct
- 1883 Avacado Ct
- 1897 Avacado Ct