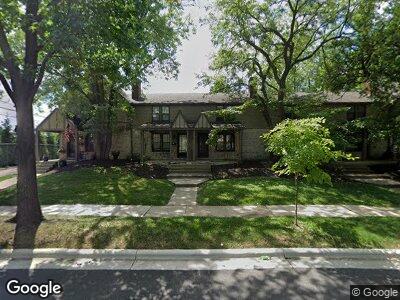
1885 Guilford Rd Columbus, OH 43221
Estimated Value: $252,000 - $314,000
2
Beds
1
Bath
1,094
Sq Ft
$268/Sq Ft
Est. Value
About This Home
This home is located at 1885 Guilford Rd, Columbus, OH 43221 and is currently estimated at $293,431, approximately $268 per square foot. 1885 Guilford Rd is a home located in Franklin County with nearby schools including Barrington Road Elementary School, Jones Middle School, and Upper Arlington High School.
Ownership History
Date
Name
Owned For
Owner Type
Purchase Details
Closed on
Sep 4, 2001
Sold by
Licklider Diane and Licklider Diane L
Bought by
Macdonald Gordon Clark and Macdonald Diane L
Current Estimated Value
Home Financials for this Owner
Home Financials are based on the most recent Mortgage that was taken out on this home.
Original Mortgage
$86,200
Outstanding Balance
$36,008
Interest Rate
7.06%
Mortgage Type
Purchase Money Mortgage
Estimated Equity
$262,734
Purchase Details
Closed on
Dec 31, 1996
Sold by
Muldoon Colleen C
Bought by
Diane Licklider
Home Financials for this Owner
Home Financials are based on the most recent Mortgage that was taken out on this home.
Original Mortgage
$90,000
Interest Rate
6.88%
Mortgage Type
New Conventional
Purchase Details
Closed on
Jul 8, 1993
Purchase Details
Closed on
May 30, 1990
Create a Home Valuation Report for This Property
The Home Valuation Report is an in-depth analysis detailing your home's value as well as a comparison with similar homes in the area
Home Values in the Area
Average Home Value in this Area
Purchase History
| Date | Buyer | Sale Price | Title Company |
|---|---|---|---|
| Macdonald Gordon Clark | -- | Chicago Title | |
| Diane Licklider | $100,000 | -- | |
| -- | -- | -- | |
| -- | $79,000 | -- |
Source: Public Records
Mortgage History
| Date | Status | Borrower | Loan Amount |
|---|---|---|---|
| Open | Macdonald Gordon Clark | $86,200 | |
| Closed | Diane Licklider | $90,000 |
Source: Public Records
Tax History Compared to Growth
Tax History
| Year | Tax Paid | Tax Assessment Tax Assessment Total Assessment is a certain percentage of the fair market value that is determined by local assessors to be the total taxable value of land and additions on the property. | Land | Improvement |
|---|---|---|---|---|
| 2024 | $5,444 | $92,260 | $21,000 | $71,260 |
| 2023 | $5,559 | $92,260 | $21,000 | $71,260 |
| 2022 | $4,947 | $69,450 | $25,030 | $44,420 |
| 2021 | $4,393 | $69,450 | $25,030 | $44,420 |
| 2020 | $4,355 | $69,450 | $25,030 | $44,420 |
| 2019 | $3,789 | $53,410 | $19,250 | $34,160 |
| 2018 | $3,881 | $53,410 | $19,250 | $34,160 |
| 2017 | $3,903 | $53,410 | $19,250 | $34,160 |
| 2016 | $3,995 | $58,110 | $14,530 | $43,580 |
| 2015 | $3,992 | $58,110 | $14,530 | $43,580 |
| 2014 | $3,947 | $58,110 | $14,530 | $43,580 |
| 2013 | $2,098 | $58,100 | $14,525 | $43,575 |
Source: Public Records
Map
Nearby Homes
- 1799 Baldridge Rd
- 2020 Andover Rd
- 2399 Brandon Rd
- 2134 Yorkshire Rd
- 2014 Edgemont Rd N
- 2432 Southway Dr
- 2036 Collingswood Rd
- 1956 Glenn Ave
- 2145 Waltham Rd
- 1585 Waltham Rd Unit 1585
- 2252 Club Rd
- 1522 Essex Rd
- 2275 Oxford Rd
- 2516 Chester Rd
- 1929 Hillside Dr
- 2586 Kent Rd
- 2528 Tremont Rd
- 1659 Tremont Rd
- 2597 York Rd
- 1818 Ashland Ave
- 1885 Guilford Rd
- 1887 Guilford Rd
- 1889 Guilford Rd Unit 1889
- 1891 Guilford Rd Unit 1891
- 1893 Guilford Rd
- 1895 Guilford Rd
- 1894 Guilford Rd
- 1884 Guilford Rd
- 1896 Guilford Rd
- 1874 Guilford Rd
- 1904 Guilford Rd Unit 1904
- 2176 Coventry Rd Unit 2176
- 1862 Guilford Rd
- 1897 Baldridge Rd
- 2182 Coventry Rd Unit 2182
- 1901 Baldridge Rd
- 1893 Baldridge Rd
- 1907 Baldridge Rd Unit 1907
- 1889 Baldridge Rd
- 1858 Guilford Rd