Estimated Value: $554,000 - $642,000
5
Beds
3
Baths
1,617
Sq Ft
$378/Sq Ft
Est. Value
About This Home
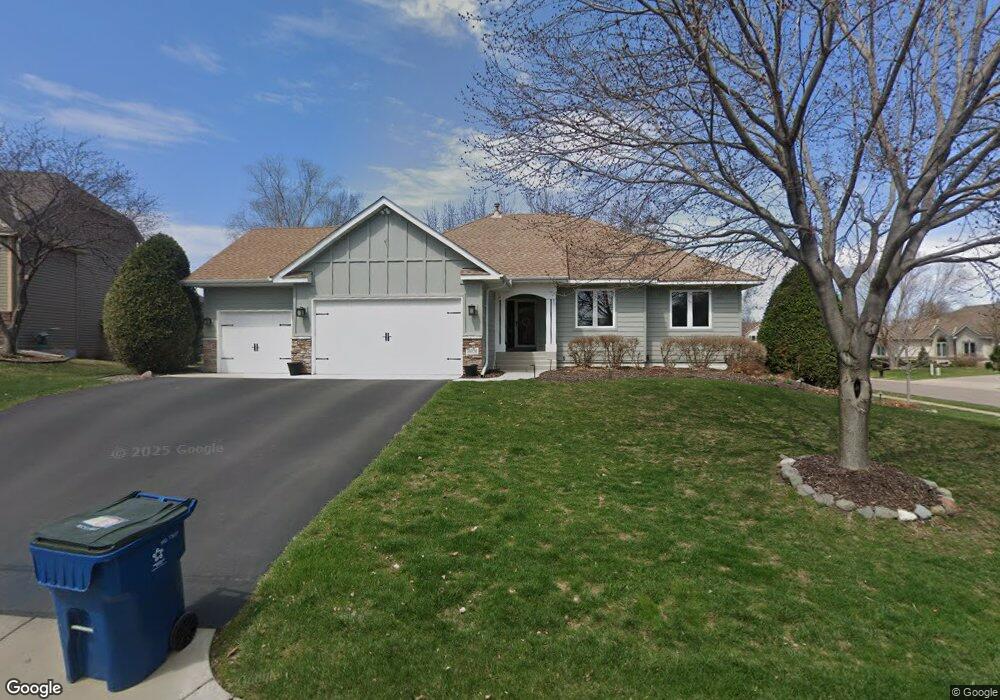
This home is located at 18850 Yarborough Trace, Osseo, MN 55311 and is currently estimated at $611,234, approximately $378 per square foot. 18850 Yarborough Trace is a home located in Hennepin County with nearby schools including Rush Creek Elementary School, Maple Grove Middle School, and Maple Grove Senior High School.
Ownership History
Date
Name
Owned For
Owner Type
Purchase Details
Closed on
Jun 22, 2017
Sold by
Heffelfinger Michael A
Bought by
Buttke Jack W and Buttke Rebecca A
Current Estimated Value
Home Financials for this Owner
Home Financials are based on the most recent Mortgage that was taken out on this home.
Original Mortgage
$311,250
Outstanding Balance
$258,895
Interest Rate
4.02%
Mortgage Type
New Conventional
Estimated Equity
$352,339
Purchase Details
Closed on
Jan 14, 2005
Sold by
Strandskov Bruce L and Strandskov Lynn M
Bought by
Heffelfinger Michael A and Heffelfinger Theresa
Purchase Details
Closed on
Mar 13, 1998
Sold by
Odin Builders Inc
Bought by
Strandskov Bruce L and Strandskov Lynn M
Create a Home Valuation Report for This Property
The Home Valuation Report is an in-depth analysis detailing your home's value as well as a comparison with similar homes in the area
Home Values in the Area
Average Home Value in this Area
Purchase History
| Date | Buyer | Sale Price | Title Company |
|---|---|---|---|
| Buttke Jack W | $415,000 | Sherbume Co Abstartc & Title | |
| Heffelfinger Michael A | $425,000 | -- | |
| Strandskov Bruce L | $186,311 | -- | |
| Odin Builders Inc | $49,900 | -- |
Source: Public Records
Mortgage History
| Date | Status | Borrower | Loan Amount |
|---|---|---|---|
| Open | Buttke Jack W | $311,250 |
Source: Public Records
Tax History Compared to Growth
Tax History
| Year | Tax Paid | Tax Assessment Tax Assessment Total Assessment is a certain percentage of the fair market value that is determined by local assessors to be the total taxable value of land and additions on the property. | Land | Improvement |
|---|---|---|---|---|
| 2024 | $7,357 | $587,400 | $156,100 | $431,300 |
| 2023 | $6,530 | $547,400 | $139,700 | $407,700 |
| 2022 | $5,502 | $514,200 | $94,500 | $419,700 |
| 2021 | $4,999 | $453,300 | $77,200 | $376,100 |
| 2020 | $5,778 | $405,600 | $46,400 | $359,200 |
| 2019 | $5,643 | $414,300 | $66,400 | $347,900 |
| 2018 | $5,583 | $410,000 | $65,400 | $344,600 |
| 2017 | $5,394 | $371,400 | $72,000 | $299,400 |
| 2016 | $5,451 | $370,100 | $77,000 | $293,100 |
| 2015 | $5,625 | $371,400 | $97,000 | $274,400 |
| 2014 | -- | $361,600 | $94,000 | $267,600 |
Source: Public Records
Map
Nearby Homes
- 9363 Tewsbury Gate N
- 9365 Tewsbury Bend
- 18244 88th Place N
- 18053 90th Place N
- 8688 Vagabond Ln N
- 19301 Schutte Rd
- 9125 Olive Ln N
- 9245 Cherry Ln
- 18644 85th Ave N
- 17913 96th Ave N
- 9260 Merrimac Ln N
- 17868 96th Ave N
- 17475 90th Ave N
- 18502 97th Place N Unit 2204
- 9803 Vagabond Ln N
- 8200 Walnut Grove Ln N
- 9872 Alvarado Ln N Unit 4803
- 10145 Peony Ln N
- 10154 Peony Ln N
- 17198 93rd Place N Unit 62
- 18872 Yarborough Trace
- 18883 Gladstone Blvd N
- 18915 Gladstone Blvd N
- 18853 Yarborough Trace
- 9104 Tewsbury Gate
- 18947 Gladstone Blvd N
- 9080 Tewsbury Gate
- 9116 Tewsbury Gate
- 9092 Tewsbury Gate
- 18875 Yarborough Trace
- 18979 Gladstone Blvd N
- 9068 Tewsbury Gate
- 18872 Gladstone Blvd N
- 18926 Yarborough Terrace
- 18926 Yarborough Trace
- 18904 Gladstone Blvd N
- 18991 Gladstone Blvd N
- 18907 Yarborough Trace
- 18850 Gladstone Blvd N
- 9056 Tewsbury Gate