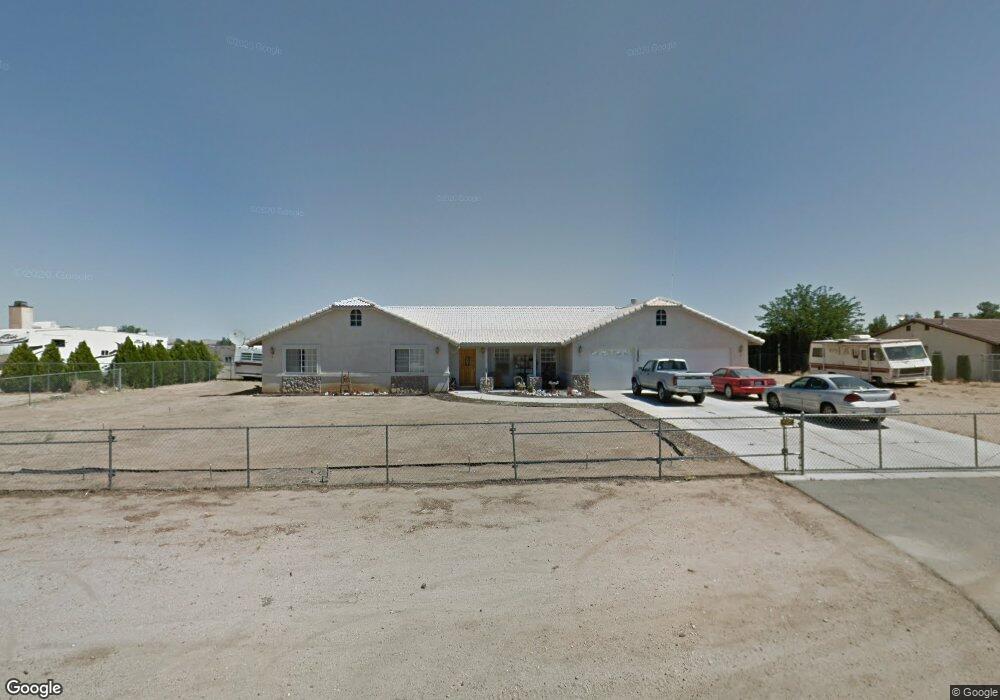
18856 Shoshonee Rd Apple Valley, CA 92307
High Desert NeighborhoodEstimated Value: $452,000 - $600,000
4
Beds
2
Baths
2,241
Sq Ft
$229/Sq Ft
Est. Value
About This Home
This home is located at 18856 Shoshonee Rd, Apple Valley, CA 92307 and is currently estimated at $514,016, approximately $229 per square foot. 18856 Shoshonee Rd is a home located in San Bernardino County with nearby schools including Rio Vista School of Applied Learning, Granite Hills High School, and Academy for Academic Excellence.
Ownership History
Date
Name
Owned For
Owner Type
Purchase Details
Closed on
May 22, 2013
Sold by
Chen Biyan
Bought by
Lee Sam E
Current Estimated Value
Home Financials for this Owner
Home Financials are based on the most recent Mortgage that was taken out on this home.
Original Mortgage
$110,000
Outstanding Balance
$66,735
Interest Rate
3.32%
Mortgage Type
Credit Line Revolving
Estimated Equity
$447,281
Purchase Details
Closed on
Aug 18, 1999
Sold by
Rylar Investments Inc
Bought by
Lee Sam and Ng Lisa Shao
Home Financials for this Owner
Home Financials are based on the most recent Mortgage that was taken out on this home.
Original Mortgage
$47,000
Interest Rate
7.77%
Purchase Details
Closed on
Feb 2, 1999
Sold by
Salazar Victor R
Bought by
Rylar Investments Inc
Create a Home Valuation Report for This Property
The Home Valuation Report is an in-depth analysis detailing your home's value as well as a comparison with similar homes in the area
Home Values in the Area
Average Home Value in this Area
Purchase History
| Date | Buyer | Sale Price | Title Company |
|---|---|---|---|
| Lee Sam E | -- | Fatco La | |
| Lee Sam | $147,000 | First American Title Ins Co | |
| Rylar Investments Inc | $18,000 | First American Title |
Source: Public Records
Mortgage History
| Date | Status | Borrower | Loan Amount |
|---|---|---|---|
| Open | Lee Sam E | $110,000 | |
| Previous Owner | Lee Sam | $47,000 |
Source: Public Records
Tax History Compared to Growth
Tax History
| Year | Tax Paid | Tax Assessment Tax Assessment Total Assessment is a certain percentage of the fair market value that is determined by local assessors to be the total taxable value of land and additions on the property. | Land | Improvement |
|---|---|---|---|---|
| 2025 | $2,852 | $248,891 | $40,223 | $208,668 |
| 2024 | $2,852 | $244,010 | $39,434 | $204,576 |
| 2023 | $2,827 | $239,226 | $38,661 | $200,565 |
| 2022 | $2,784 | $234,535 | $37,903 | $196,632 |
| 2021 | $2,720 | $229,936 | $37,160 | $192,776 |
| 2020 | $2,687 | $227,578 | $36,779 | $190,799 |
| 2019 | $2,638 | $223,116 | $36,058 | $187,058 |
| 2018 | $2,573 | $218,741 | $35,351 | $183,390 |
| 2017 | $2,538 | $214,452 | $34,658 | $179,794 |
| 2016 | $2,437 | $210,247 | $33,978 | $176,269 |
| 2015 | $2,401 | $207,089 | $33,468 | $173,621 |
| 2014 | $2,369 | $203,032 | $32,812 | $170,220 |
Source: Public Records
Map
Nearby Homes
- 13955 Cuyamaca Rd
- 19145 Shoshonee Rd
- 14405 Mandan Rd
- 18715 Mingo Rd
- 14455 Havasu Rd
- 13771 Wawona Rd
- 14118 Monte Verde Ave
- 18475 Trout
- 18490 Trout Ln
- 18510 Seneca Rd
- 18286 Lakeview Dr
- 13501 Driftwood Dr
- 19446 Shoshonee Rd
- 0 Riverside Dr Unit HD25148269
- 14610 Apple Valley Rd
- 14705 Mandan Rd
- 19391 Seneca Rd
- 13395 Driftwood Dr
- 18055 Lakeview Dr
- 18160 Harbor Dr
- 18846 Shoshonee Rd
- 18876 Shoshonee Rd
- 18855 Shoshonee Rd
- 18875 Shoshonee Rd
- 18845 Shoshonee Rd
- 18891 Shoshonee Rd
- 18810 Shoshonee Rd
- 13964 Hudson Ct
- 18910 Shoshonee Rd
- 14013 Siesta Rd
- 14008 Havasu Rd
- 14062 Havasu Rd
- 13968 Hudson Ct
- 14003 Siesta Rd
- 13962 Hudson Ct
- 18790 Shoshonee Rd
- 14082 Havasu Rd
- 13996 Havasu Rd
- 13981 Siesta Rd
- 14100 Havasu Rd