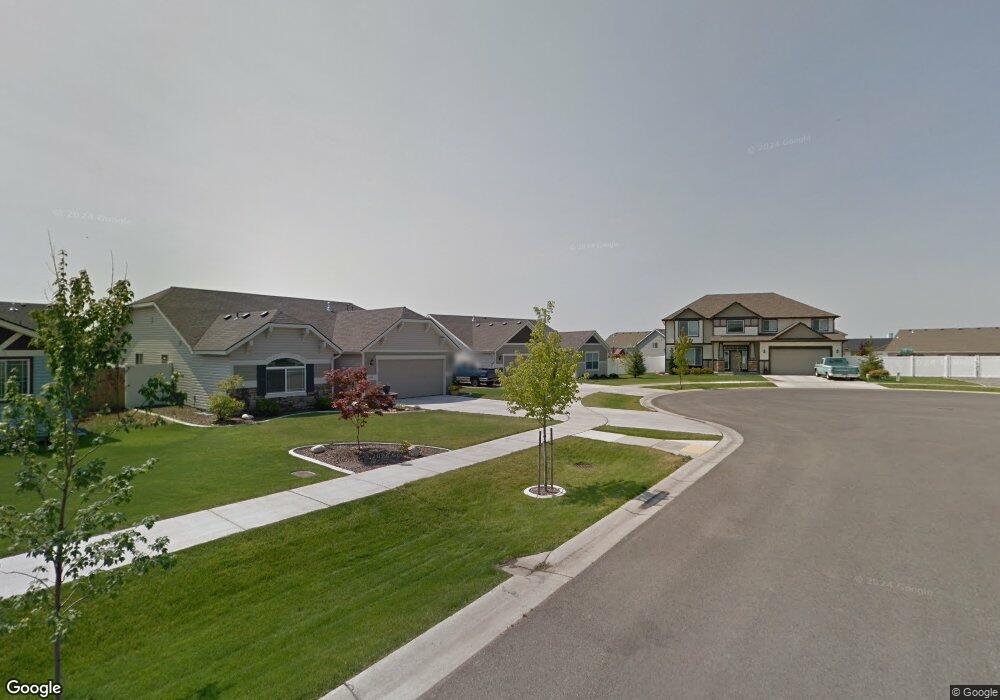
1886 E Dipper Loop Post Falls, ID 83854
North Prairie NeighborhoodEstimated Value: $478,000 - $542,000
3
Beds
2
Baths
1,652
Sq Ft
$306/Sq Ft
Est. Value
About This Home
This home is located at 1886 E Dipper Loop, Post Falls, ID 83854 and is currently estimated at $504,949, approximately $305 per square foot. 1886 E Dipper Loop is a home located in Kootenai County with nearby schools including Prairie View Elementary School, Post Falls Middle School, and Post Falls High School.
Ownership History
Date
Name
Owned For
Owner Type
Purchase Details
Closed on
Apr 5, 2019
Sold by
Wileox Duane L and Wileox Duane L
Bought by
Wileox Duane L and Wileox Karina M
Current Estimated Value
Purchase Details
Closed on
Apr 29, 2016
Sold by
Pelican Nicholas T and Pelican Amanda D
Bought by
Wilcox Duane L
Home Financials for this Owner
Home Financials are based on the most recent Mortgage that was taken out on this home.
Original Mortgage
$150,000
Outstanding Balance
$65,742
Interest Rate
3.71%
Mortgage Type
New Conventional
Estimated Equity
$439,207
Purchase Details
Closed on
Nov 20, 2012
Sold by
Young Kathie L
Bought by
Pelican Nicholas Tt and Prestegaard Amanda D
Home Financials for this Owner
Home Financials are based on the most recent Mortgage that was taken out on this home.
Original Mortgage
$180,612
Interest Rate
3.33%
Mortgage Type
New Conventional
Create a Home Valuation Report for This Property
The Home Valuation Report is an in-depth analysis detailing your home's value as well as a comparison with similar homes in the area
Home Values in the Area
Average Home Value in this Area
Purchase History
| Date | Buyer | Sale Price | Title Company |
|---|---|---|---|
| Wileox Duane L | -- | None Available | |
| Wilcox Duane L | -- | Alliance Title Coeur D Alene | |
| Pelican Nicholas Tt | -- | Alliance Title -Boice |
Source: Public Records
Mortgage History
| Date | Status | Borrower | Loan Amount |
|---|---|---|---|
| Open | Wilcox Duane L | $150,000 | |
| Previous Owner | Pelican Nicholas Tt | $180,612 |
Source: Public Records
Tax History
| Year | Tax Paid | Tax Assessment Tax Assessment Total Assessment is a certain percentage of the fair market value that is determined by local assessors to be the total taxable value of land and additions on the property. | Land | Improvement |
|---|---|---|---|---|
| 2025 | $1,735 | $445,120 | $175,000 | $270,120 |
| 2024 | $1,676 | $423,630 | $152,000 | $271,630 |
| 2023 | $1,676 | $453,360 | $160,000 | $293,360 |
| 2022 | $2,226 | $483,456 | $157,500 | $325,956 |
| 2021 | $1,859 | $305,890 | $105,000 | $200,890 |
| 2020 | $1,972 | $270,470 | $90,000 | $180,470 |
| 2019 | $2,067 | $261,690 | $90,000 | $171,690 |
| 2018 | $1,796 | $226,580 | $70,000 | $156,580 |
| 2017 | $1,600 | $202,690 | $50,000 | $152,690 |
| 2016 | $1,504 | $182,050 | $40,000 | $142,050 |
| 2015 | $1,486 | $176,880 | $37,000 | $139,880 |
| 2013 | $1,374 | $150,740 | $32,000 | $118,740 |
Source: Public Records
Map
Nearby Homes
- 2653 E Thrush
- 1988 E Dipper Loop
- 1462 E Allenby Ave
- 3154 E Thrush
- 3294 N Segar Loop
- 3310 N Segar Loop
- 3265 N Segar Loop
- 3648 White Sands Ln
- 3328 N Segar Loop
- 3283 N Segar Loop
- 3321 N Segar Loop
- 3322 N Claremont Dr
- 2435 N Bunchgrass Dr
- 4350 E Bogie Dr
- 4184 E Bogie Dr
- 4226 E Bogie Dr
- 4398 E Bogie Dr
- 4314 E Bogie Dr
- 4264 E Bogie Dr
- 4440 E Bogie Dr
- 1886 Dipper Loop
- 1878 E Dipper Loop
- 1898 Dipper Loop
- 1878 Dipper Loop
- 1898 E Dipper Loop
- 1741 E Warbler Ln
- 1741 Warbler Ln
- 1765 Warbler Ln
- 1719 Warbler Ln
- 1870 E Dipper Loop
- 1870 Dipper Loop
- 1920 E Dipper Loop
- 1791 E Warbler Ln
- 1870 E Dipper Loop
- 1791 Warbler Ln
- 2699 Thrush Dr
- 2715 E Thrush Dr
- 2685 Thrush Dr
- 1940 E Dipper Loop
- 2729 E Thrush Dr
Your Personal Tour Guide
Ask me questions while you tour the home.