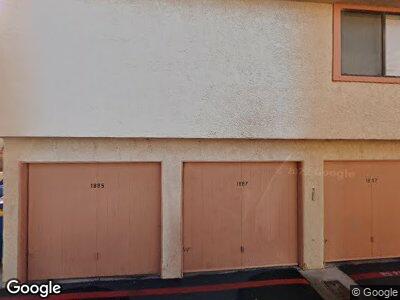
1887 Avacado Ct Unit A Henderson, NV 89014
Green Valley North NeighborhoodEstimated Value: $275,302 - $295,000
3
Beds
2
Baths
1,176
Sq Ft
$245/Sq Ft
Est. Value
About This Home
This home is located at 1887 Avacado Ct Unit A, Henderson, NV 89014 and is currently estimated at $288,326, approximately $245 per square foot. 1887 Avacado Ct Unit A is a home located in Clark County with nearby schools including Harriet Treem Elementary School, Jim Thorpe Elementary School, and Francis H Cortney Junior High School.
Ownership History
Date
Name
Owned For
Owner Type
Purchase Details
Closed on
Jul 23, 2004
Sold by
Levine Evelyn M
Bought by
Levine Evelyn M
Current Estimated Value
Home Financials for this Owner
Home Financials are based on the most recent Mortgage that was taken out on this home.
Original Mortgage
$60,000
Outstanding Balance
$31,368
Interest Rate
6.29%
Mortgage Type
Stand Alone Refi Refinance Of Original Loan
Estimated Equity
$258,255
Purchase Details
Closed on
Oct 13, 1994
Sold by
Levine Arthur M
Bought by
Levine Evelyn M
Home Financials for this Owner
Home Financials are based on the most recent Mortgage that was taken out on this home.
Original Mortgage
$64,000
Interest Rate
7.5%
Purchase Details
Closed on
Oct 12, 1994
Sold by
Koss Charlotte and Koss Ernest F
Bought by
Levine Evelyn M and Levine William J
Home Financials for this Owner
Home Financials are based on the most recent Mortgage that was taken out on this home.
Original Mortgage
$64,000
Interest Rate
7.5%
Create a Home Valuation Report for This Property
The Home Valuation Report is an in-depth analysis detailing your home's value as well as a comparison with similar homes in the area
Home Values in the Area
Average Home Value in this Area
Purchase History
| Date | Buyer | Sale Price | Title Company |
|---|---|---|---|
| Levine Evelyn M | -- | Old Republic Title Company O | |
| Levine Evelyn M | -- | Nevada Title Company | |
| Levine Evelyn M | $80,000 | Nevada Title Company |
Source: Public Records
Mortgage History
| Date | Status | Borrower | Loan Amount |
|---|---|---|---|
| Open | Levine Evelyn M | $60,000 | |
| Closed | Levine Evelyn M | $64,000 |
Source: Public Records
Tax History Compared to Growth
Tax History
| Year | Tax Paid | Tax Assessment Tax Assessment Total Assessment is a certain percentage of the fair market value that is determined by local assessors to be the total taxable value of land and additions on the property. | Land | Improvement |
|---|---|---|---|---|
| 2025 | $644 | $43,734 | $21,350 | $22,384 |
| 2024 | $597 | $43,734 | $21,350 | $22,384 |
| 2023 | $597 | $45,841 | $24,500 | $21,341 |
| 2022 | $553 | $39,760 | $19,005 | $20,755 |
| 2021 | $512 | $34,688 | $17,500 | $17,188 |
| 2020 | $473 | $35,793 | $17,500 | $18,293 |
| 2019 | $443 | $32,479 | $14,000 | $18,479 |
| 2018 | $423 | $26,747 | $8,750 | $17,997 |
| 2017 | $722 | $24,918 | $6,650 | $18,268 |
| 2016 | $397 | $23,203 | $5,600 | $17,603 |
| 2015 | $395 | $19,167 | $3,850 | $15,317 |
| 2014 | $383 | $12,839 | $3,500 | $9,339 |
Source: Public Records
Map
Nearby Homes
- 2007 Cutlass Dr Unit 58
- 680 Cervantes Dr
- 1979 Cutlass Dr Unit 72
- 1969 Cutlass Dr Unit 77
- 1955 Cutlass Dr Unit 1955
- 1947 Cutlass Dr Unit 88
- 1951 Scimitar Dr
- 642 Cervantes Dr
- 614 Cervantes Dr Unit 49
- 741 Nectarine Ct Unit D
- 613 Cervantes Dr
- 718 Nectarine Ct Unit D
- 2462 Marlene Way
- 2700 Osborne Ln
- 759 Sunrise Crossing St
- 2416 Greens Ave
- 2428 Greens Ave
- 2425 Greens Ave
- 2507 Albemarle Way
- 780 Flowing Meadow Dr
- 1887 Avacado Ct Unit A
- 1885 Avacado Ct Unit B
- 1883 Avacado Ct
- 1891 Avacado Ct
- 1881 Avacado Ct
- 1879 Avacado Ct
- 1877 Avacado Ct
- 1897 Avacado Ct
- 1897 Avacado Ct Unit A
- 1890 Avacado Ct
- 1890 Avacado Ct Unit D
- 1895 Avacado Ct Unit C
- 1893 Avacado Ct Unit D
- 1899 Avacado Ct Unit B
- 1899 Avacado Ct
- 1888 Avacado Ct
- 1884 Avacado Ct Unit na
- 1884 Avacado Ct
- 1886 Avacado Ct Unit A
- 1880 Avacado Ct