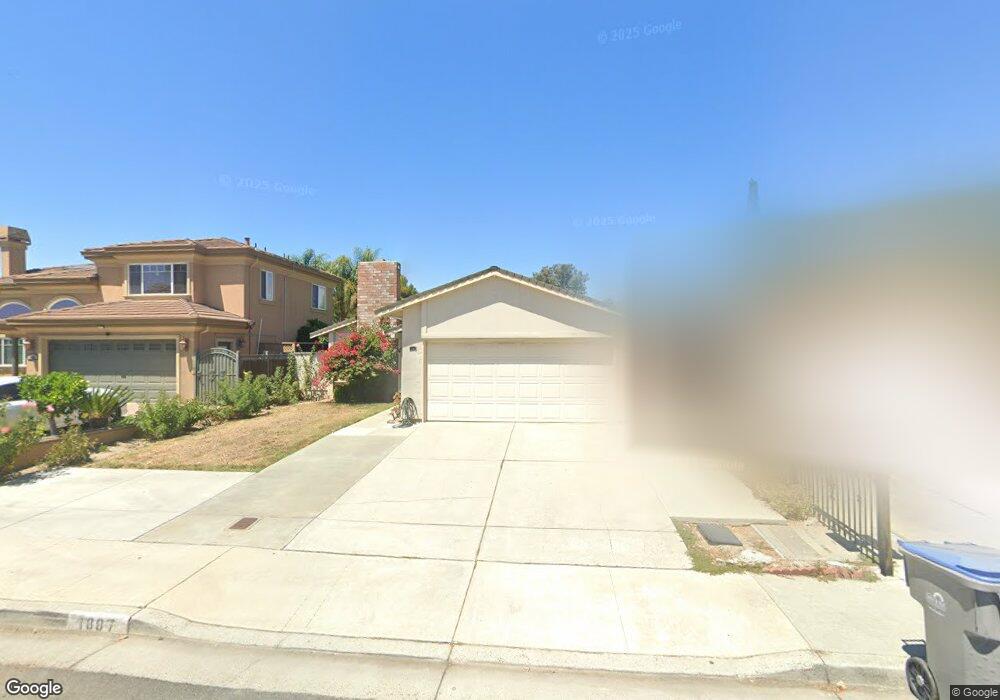
1887 Diamente Ct San Jose, CA 95116
Checkers NeighborhoodEstimated Value: $1,121,000 - $1,234,000
5
Beds
3
Baths
1,005
Sq Ft
$1,175/Sq Ft
Est. Value
About This Home
This home is located at 1887 Diamente Ct, San Jose, CA 95116 and is currently estimated at $1,180,808, approximately $1,174 per square foot. 1887 Diamente Ct is a home located in Santa Clara County with nearby schools including San Antonio Elementary School, Independence High School, and Rocketship Fuerza Community Prep.
Ownership History
Date
Name
Owned For
Owner Type
Purchase Details
Closed on
Mar 1, 2024
Sold by
Gorgonio Laodicea A
Bought by
2023 Laodicea A Gorgonio Irrevocable Trust and Gorgonio
Current Estimated Value
Purchase Details
Closed on
Dec 6, 2004
Sold by
Gorgonio Mary Jane G and Gorgonio Abemael A
Bought by
Gorgonio Laodicea A
Home Financials for this Owner
Home Financials are based on the most recent Mortgage that was taken out on this home.
Original Mortgage
$300,000
Interest Rate
5.64%
Mortgage Type
New Conventional
Purchase Details
Closed on
Sep 4, 2002
Sold by
Gorgonio Laodicea A and Gorgonio Dan A
Bought by
Gorgonio Laodicea A and Gorgonio Abemael A
Home Financials for this Owner
Home Financials are based on the most recent Mortgage that was taken out on this home.
Original Mortgage
$235,000
Interest Rate
6.37%
Create a Home Valuation Report for This Property
The Home Valuation Report is an in-depth analysis detailing your home's value as well as a comparison with similar homes in the area
Home Values in the Area
Average Home Value in this Area
Purchase History
| Date | Buyer | Sale Price | Title Company |
|---|---|---|---|
| 2023 Laodicea A Gorgonio Irrevocable Trust | -- | None Listed On Document | |
| Gorgonio Laodicea A | -- | Alliance Title Company | |
| Gorgonio Laodicea A | -- | Alliance Title Company |
Source: Public Records
Mortgage History
| Date | Status | Borrower | Loan Amount |
|---|---|---|---|
| Previous Owner | Gorgonio Laodicea A | $300,000 | |
| Previous Owner | Gorgonio Laodicea A | $235,000 |
Source: Public Records
Tax History Compared to Growth
Tax History
| Year | Tax Paid | Tax Assessment Tax Assessment Total Assessment is a certain percentage of the fair market value that is determined by local assessors to be the total taxable value of land and additions on the property. | Land | Improvement |
|---|---|---|---|---|
| 2025 | $10,246 | $682,754 | $408,566 | $274,188 |
| 2024 | $10,246 | $669,367 | $400,555 | $268,812 |
| 2023 | $10,047 | $656,243 | $392,701 | $263,542 |
| 2022 | $9,853 | $643,376 | $385,001 | $258,375 |
| 2021 | $9,519 | $630,761 | $377,452 | $253,309 |
| 2020 | $9,342 | $624,294 | $373,582 | $250,712 |
| 2019 | $9,088 | $612,054 | $366,257 | $245,797 |
| 2018 | $8,972 | $600,054 | $359,076 | $240,978 |
| 2017 | $9,009 | $588,289 | $352,036 | $236,253 |
| 2016 | $8,499 | $576,755 | $345,134 | $231,621 |
| 2015 | $8,498 | $568,092 | $339,950 | $228,142 |
| 2014 | $7,081 | $489,500 | $292,900 | $196,600 |
Source: Public Records
Map
Nearby Homes
- 295 Esmeralda Ct
- 1715 Calle de Plata
- 1826 Perrone Cir
- 125 Magellan Ave
- 67 Silcreek Dr
- 1816 Luby Dr Unit 46
- 264 N 34th St
- 88 N Jackson Ave Unit 322
- 88 N Jackson Ave Unit 105
- 86 Eastwood Ct
- 2177 Alum Rock Ave Unit 112
- 210 Damsen Dr Unit 22
- 230 Montclair Ave
- 76 Sunset Ct
- 127 Schott St
- 1622 Perry Ct
- 1565 E Saint James St
- 64 Via de Guadalupe
- 171 S Sunset Ave
- 1889 Sable Place
- 1893 Diamente Ct
- 1881 Diamente Ct
- 1875 Diamente Ct
- 286 Esmeralda Ct
- 1888 Diamente Ct
- 1894 Diamente Ct
- 292 Esmeralda Ct
- 1882 Diamente Ct
- 280 Esmeralda Ct
- 274 Esmeralda Ct
- 1876 Diamente Ct
- 268 Esmeralda Ct
- 296 Esmeralda Ct
- 262 Esmeralda Ct
- 1885 Avenida de Cobre
- 1891 Avenida de Cobre
- 256 Esmeralda Ct
- 1879 Avenida de Cobre
- 1873 Avenida de Cobre
- 250 Esmeralda Ct